Ethereum Price Closes On $3k as Tom Lee Predicts $7K–$9K by 2026

The Ethereum price has surged by a fraction of a percentage to trade at $2,950 on a 37% plunge in the daily trading volume to $7.56 billion.
This is after Fundstrat’s Tom Lee said that Ethereum could climb to between $7,000 and $9,000 by early 2026. Lee argues that ETH’s value is being driven by structural demand rather than short-term momentum.
Speaking on CNBC, Lee noted that recent volatility followed a liquidation event in October 2025, which temporarily reduced liquidity. He stressed this phase represents a recovery, not a fundamental breakdown.
Lee’s thesis centers on tokenization, faster settlement, and growing institutional adoption. He said traditional finance is increasingly exploring blockchain-based settlement systems for efficiency gains, a trend that strongly favors Ethereum due to its established network and consistent on-chain activity.
Demand linked to real-world financial use, Lee added, is more stable than speculative, cycle-driven rallies. Institutional confidence was further underscored by BitMine Immersion’s large-scale ETH staking move.
The firm recently staked 342,560 ETH, valued at about $1 billion, and holds over four million ETH—around 3.4% of Ethereum’s circulating supply. This shift from passive holding to active staking highlights Ethereum’s expanding role in long-term institutional strategies.
Ethereum Price Bearish Structure Emerges Below $3,000 Resistance
Ethereum (ETH) is trading near $2,950, and the daily chart shows growing downside pressure. The price is struggling to move higher after failing to break above key resistance levels, suggesting sellers are still in control.
Earlier, ETH moved out of a long consolidation zone, which acted as strong support and pushed the price toward the $4,800–$5,000 area. That level marked a major resistance, where the rally was rejected. Since then, Ethereum has been forming lower highs, confirming a shift from an uptrend to a weaker market structure.
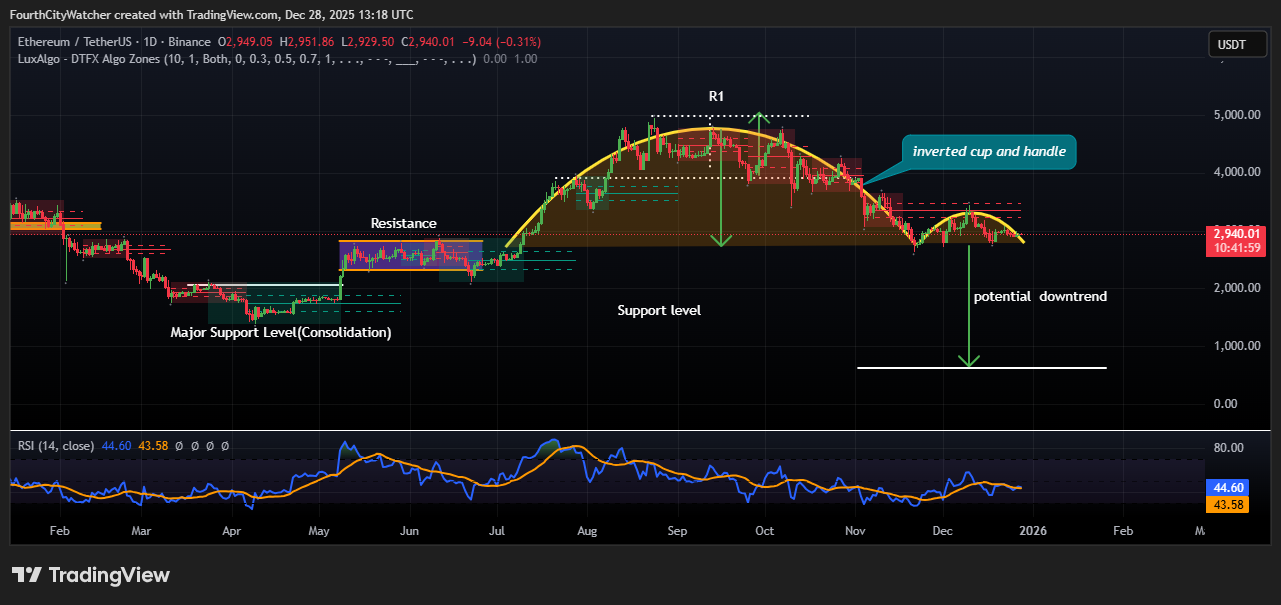
ETHUSDT Chart Analysis: Source: Tradingview
The chart now shows an inverted cup-and-handle pattern, which is typically bearish. This pattern signals that the price may continue falling if support fails. Ethereum is currently trading below its previous support zone around $3,100–$3,200, which has now turned into resistance. As long as the price stays below this range, upside moves are likely to be limited.
Ethereum Price Struggles at Support With RSI Below Neutral
The current support zone is being tested. If ETH breaks and closes below this level, the next major support lies much lower, around the $1,800–$2,000 region, where price previously consolidated.
Momentum indicators also reflect weakness. The RSI (14) is around 44, below the neutral 50 mark. This indicates buying momentum is weak and sellers still have the upper hand.
Ethereum remains under pressure in the short term. Bulls need a strong daily close above resistance to regain control. Until then, the technical structure points to continued downside risk.