Unclear ETF Flows Add Pressure to Bearish Technical Setup, Ethereum Price Slips below $3000

Ethereum slipped below the $3,000 mark after falling about 3% in the past 24 hours, as investors weighed mixed signals from U.S. spot Ether ETFs and a weakening technical setup.
The drop in the ETH price comes as U.S. spot Ether ETFs see mixed investor flows in recent sessions. After a week of heavy selling that pushed more than $700 million out of Ether ETF products, funds recorded a modest rebound with $84.6 million in net inflows on Monday, signaling easing selling pressure rather than a clear shift in sentiment.
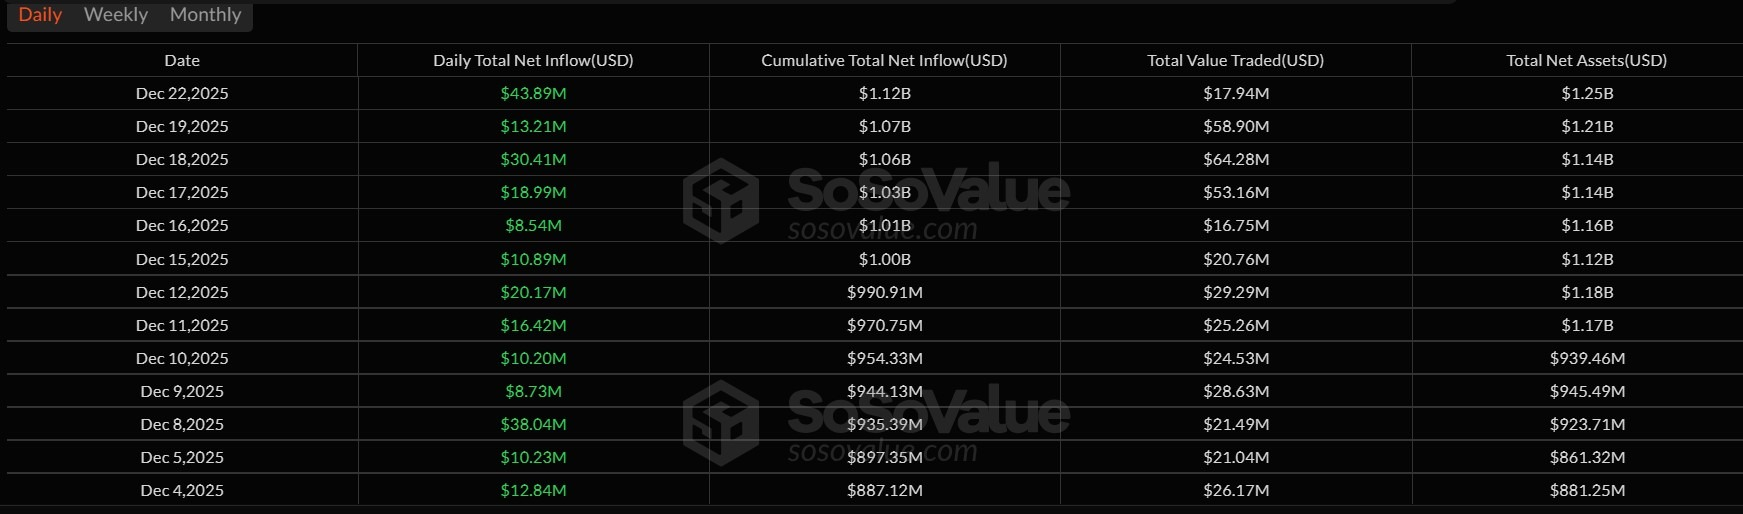
Total cumulative inflows into Ether ETFs now stand at about $12.5 billion, according to SoSoValue.
At the same time, XRP ETFs remained strong, adding $43.9 million in net inflows, their best daily performance since early December. XRP ETFs have not recorded a single net outflow day since launch, pushing cumulative inflows above $1.1 billion. The steady demand suggests investors are gradually building long-term positions rather than chasing short-term price moves.
Other altcoin ETFs showed mixed but stable trends. Solana ETFs continued to attract steady inflows, lifting total inflows to around $750 million, with only a few outflow days since launch. Chainlink ETFs added nearly $2 million, bringing cumulative inflows to about $58 million.
In contrast, Dogecoin ETFs weakened further, with cumulative inflows stuck near $2 million and very low trading activity.
Despite some positive altcoin flows, the broader market remains under pressure. Global crypto ETPs recorded nearly $1 billion in net outflows last week, mainly from Bitcoin and Ether products, driven by regulatory uncertainty and selling by large investors.
Ethereum Price Signals Bearish Momentum
While ETF flows showed a brief rebound after heavy outflows last week, the recovery has not been strong enough to restore confidence, leaving ETH under pressure as bearish momentum builds around key support levels.
Ethereum’s price shows clear signs of weakness on the daily chart as bearish pressure continues to build. ETH is trading around $2,930, down about 3% on the day, and remains well below its recent highs.
Earlier in the year, Ethereum rallied strongly from a major consolidation support zone and climbed toward the $4,500 resistance area. However, sellers took control at that level, triggering a reversal. Since then, ETH has broken below key support zones, confirming a shift from a bullish to a bearish market structure.
The chart displays an inverted cup and handle pattern, indicating a bearish continuation signal. After the initial drop, ETH attempted a short-term bounce in December but failed to break above resistance around $3,400–$3,500. This rejection suggests that buyers lack strength and that sellers remain in control.
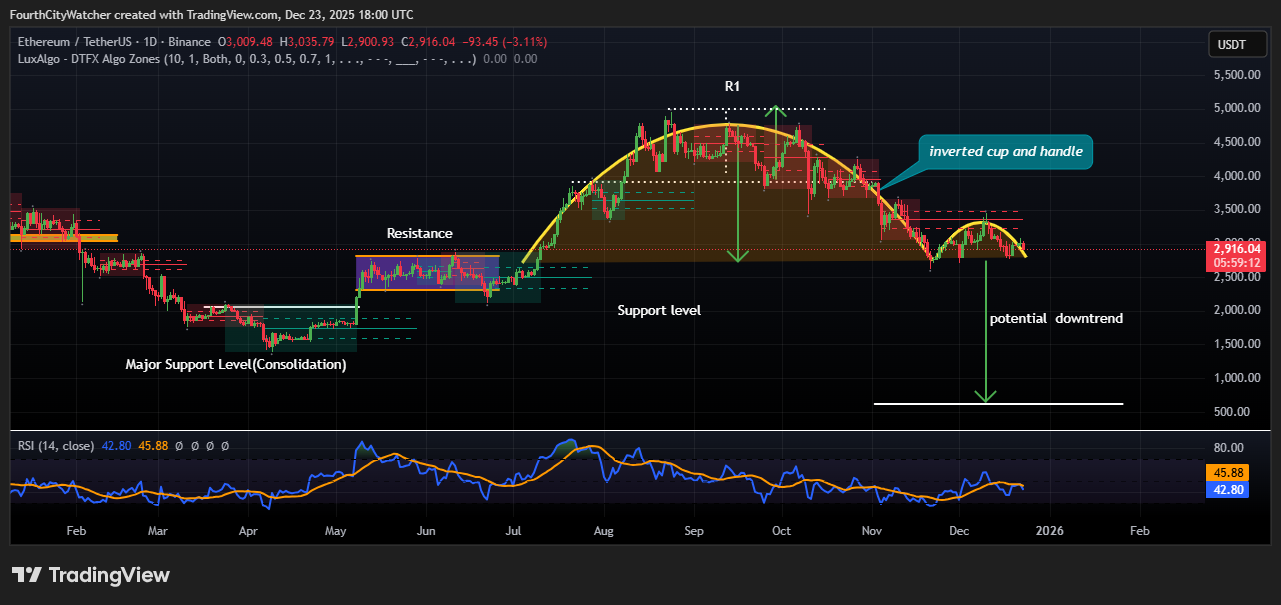
Momentum indicators support this view. The RSI (14) is sitting in the low-to-mid 40s, below the neutral 50 level. This shows weak buying momentum and no strong signs of a bullish reversal yet.
If the current trend continues, ETH could move lower toward the next support area near $2,500. A deeper decline is possible if selling pressure increases. For the outlook to improve, ETH would need to reclaim broken resistance levels and push the RSI back above 50.
Until that happens, Ethereum is likely to remain under pressure, with risks tilted toward further downside or sideways consolidation in the short term.