Ethereum Price Tumbles 3.5% As BitMine’s Tom Lee Says ETH Has ‘Already Bottomed,’ Buys Another $112M

The Ethereum price tumbled 3.5% over the past 24 hours to trade at $3,207 as of 4:41 a.m. EST on trading volume that climbed 10% to $36.2 billion.
This comes as BitMine Immersion Technologies chairman and Fundstrat’s chief investment officer, Tom Lee, says Ethereum has already bottomed.
“BitMine believes Ethereum has already bottomed,” said Lee. “Compared to two weeks ago, the amount of Ethereum we’re buying is more than double.”
Meanwhile, the Ethereum treasury firm purchased another $112 million worth of ETH on Wednesday.
Data from Arkham Intelligence, as cited by EmberCN, shows that BitMine acquired 33,504 ETH through FalconX.
BitMine has yet to confirm the transaction.
BitMine continues to reiterate its goal of accumulating 5% of the total Ethereum supply and its commitment to Ethereum’s growing role in the financial market. It already holds more than 3% of the ETH supply.
Can the price of Ethereum recover from the current downtrend?
Ethereum Price Holding Support, Poised For A Rally
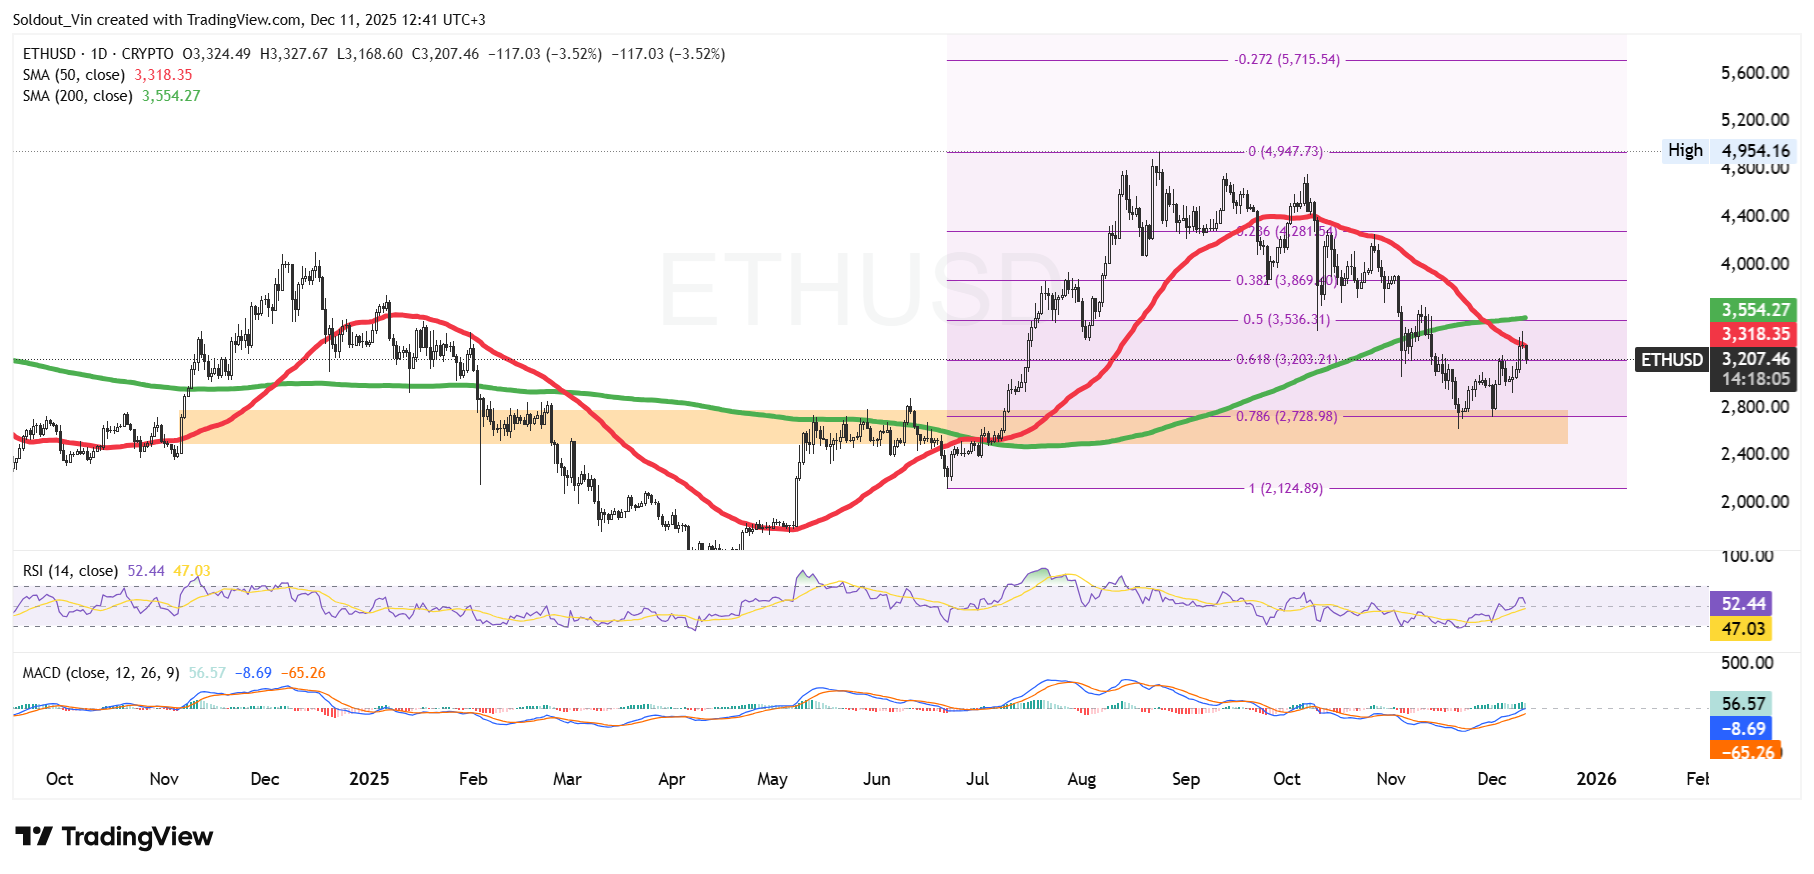
After dipping toward the major support zone around $2,750–$2,850 in late November, the ETH price recovered, climbing back above $3,300 on the daily chart.
With the prior decline from the all-time high (ATH) around $4,954, the Ethereum price moved firmly beneath both the 50-day and 200-day Simple Moving Averages (SMAs), confirming a broader bearish trend and keeping downward pressure on the price structure.
However, the strong reaction from the highlighted demand zone pushed Ethereum’s price even higher, though it remains capped below the 0.618 Fibonacci retracement level at $3,203.
This leaves ETH oscillating in a tight range between the 0.786 and 0.618 Fib levels, $2,728 and $3,203, respectively.
ETH is currently trading just beneath the 50-day and 200-day SMAs, attempting to reclaim these higher-timeframe momentum signals.
Meanwhile, the Relative Strength Index (RSI) has climbed into the 52 zone, suggesting early bullish momentum, though ETH buyers have yet to establish sustained control.
Moreover, the Moving Average Convergence Divergence (MACD) indicator also reflects improving momentum, as the blue MACD line recently crossed above the orange signal line.
ETH Price Prediction
Based on the 1-day chart, the ETH price appears to be stabilising between the 0.786–0.618 Fib retracement zone and the long-term demand region.
If Ethereum manages to hold above this area and break decisively above the $3,203 resistance, and claims the 50-day and 200-day SMAs, a recovery toward the mid-range Fibonacci levels, around $3,536–$3,870, becomes increasingly likely.
A stronger breakout may then target the upper Fib zones near $4,280 and $4,947.
However, if the price of Ethereum fails to break above the two SMAs and loses support around $2,728, momentum could shift bearish once again, opening the door to a retest of lower retracement levels toward $2,124.