Ethereum USD Activity Hits Record Highs While Price Lags: Powder Keg Building?
Ethereum Activity Hits Record Highs While Price Lags

Ethereum USD is currently printing numismatic-grade network fundamentals while the market treats it like a common circulation strike, creating one of the most palpable divergences in recent crypto history.
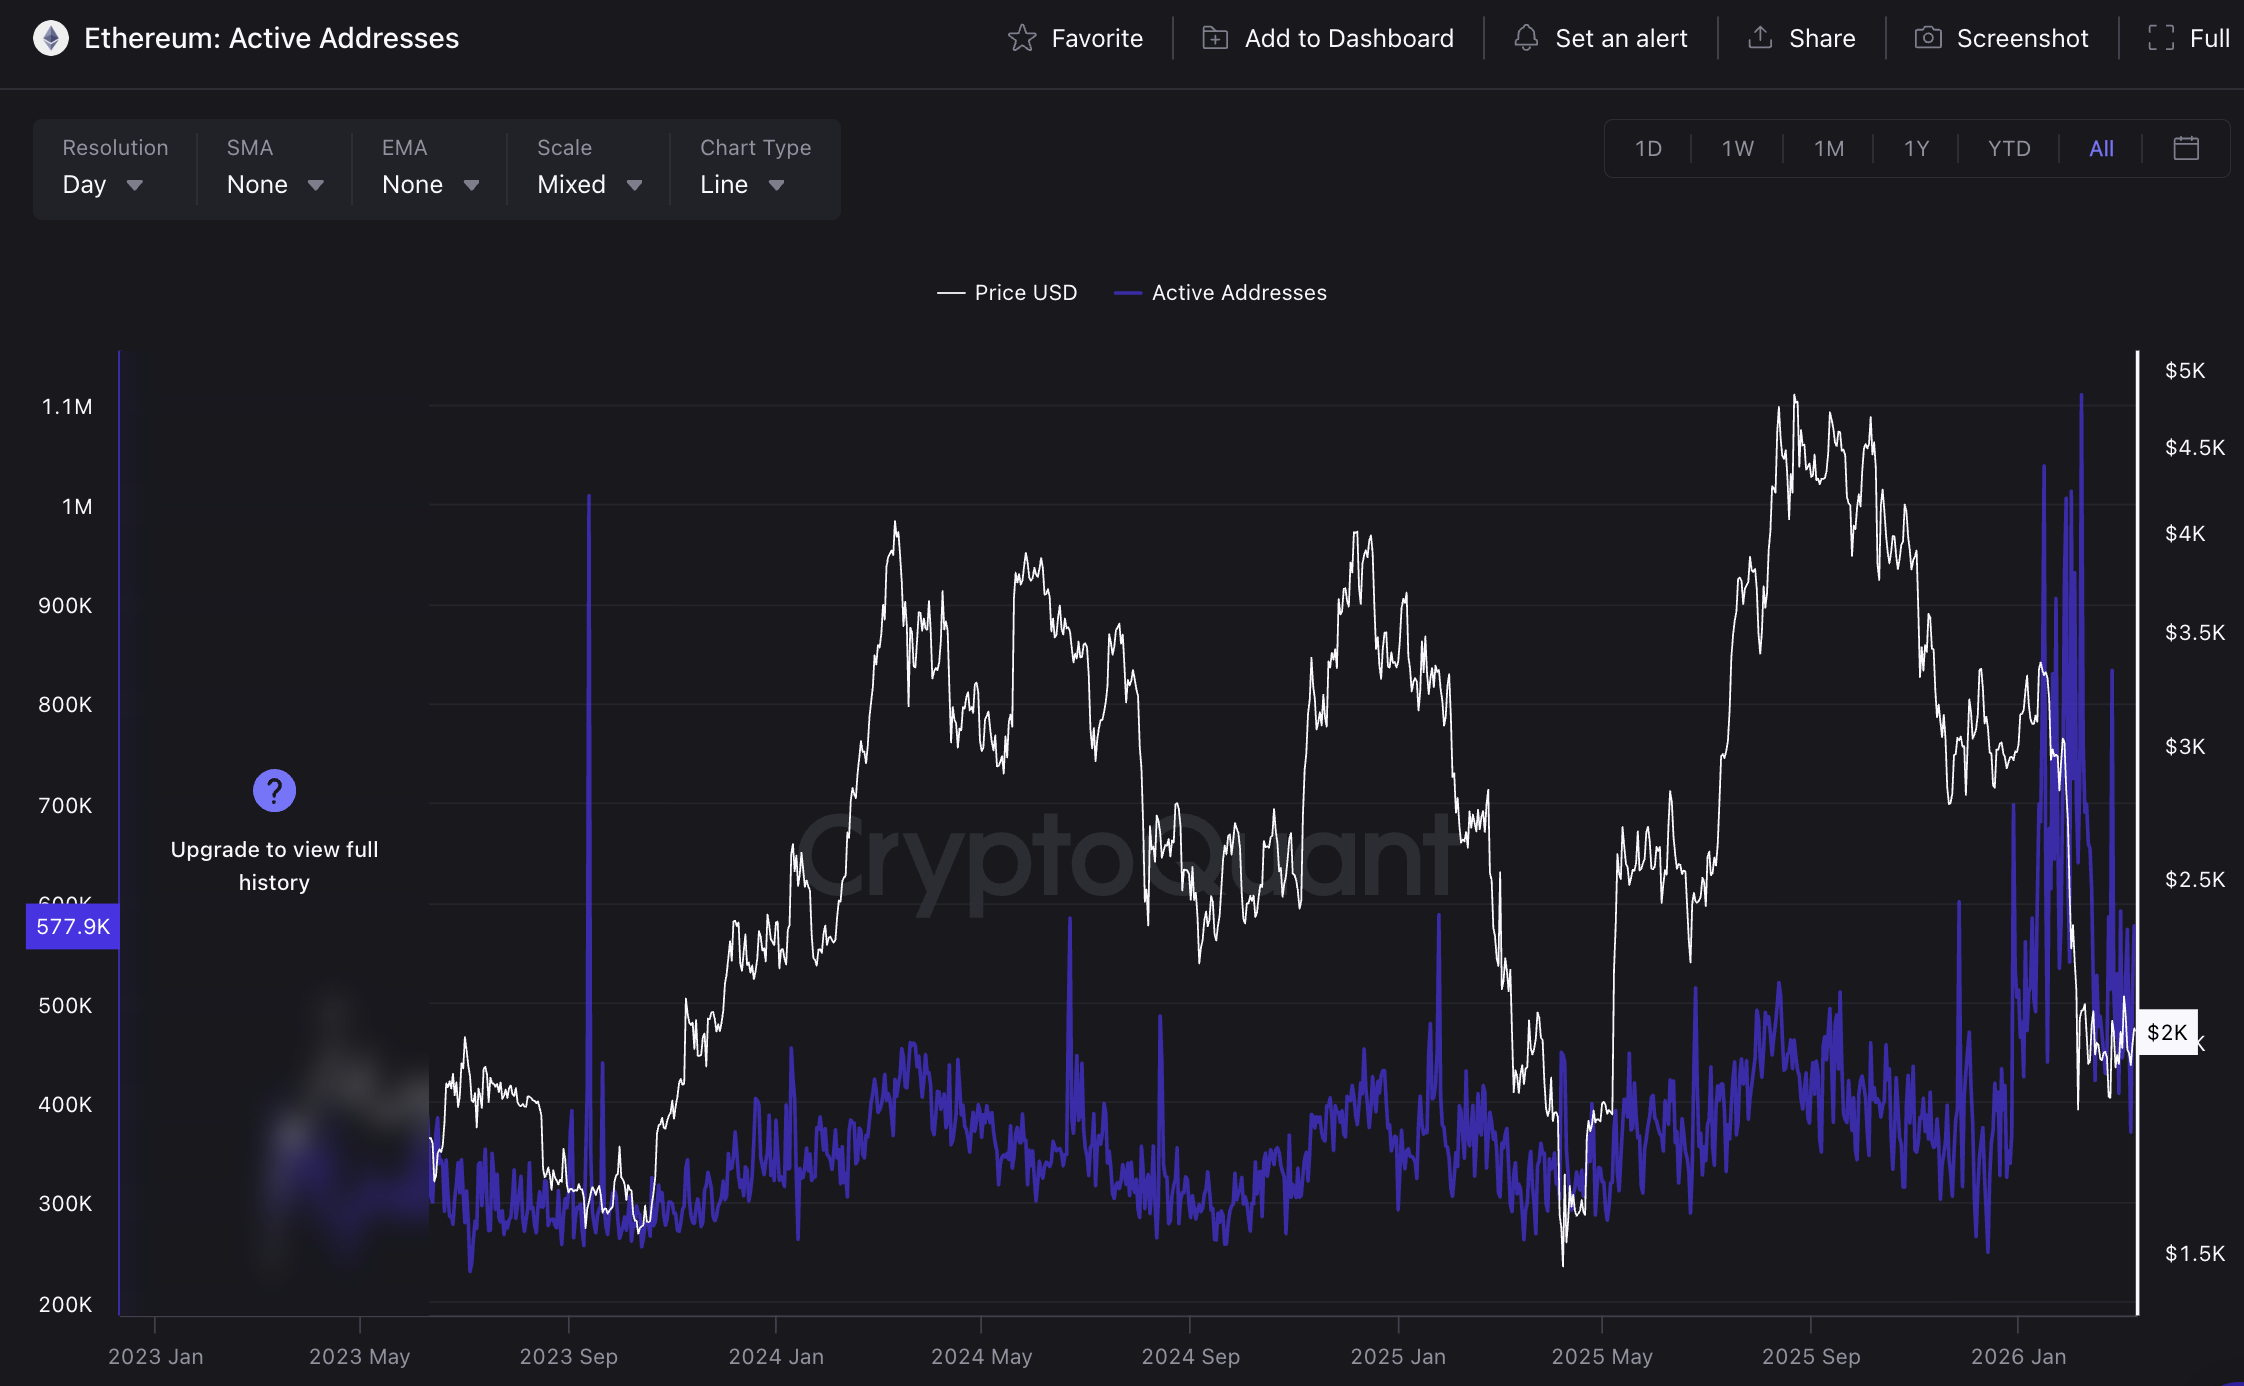
Daily active addresses on the network surged to nearly 2 million in February 2026, eclipsing the speculative mania of the 2021 bull run, yet the ETH price remains surprisingly lethargic, drifting down roughly 30% over the last six months.
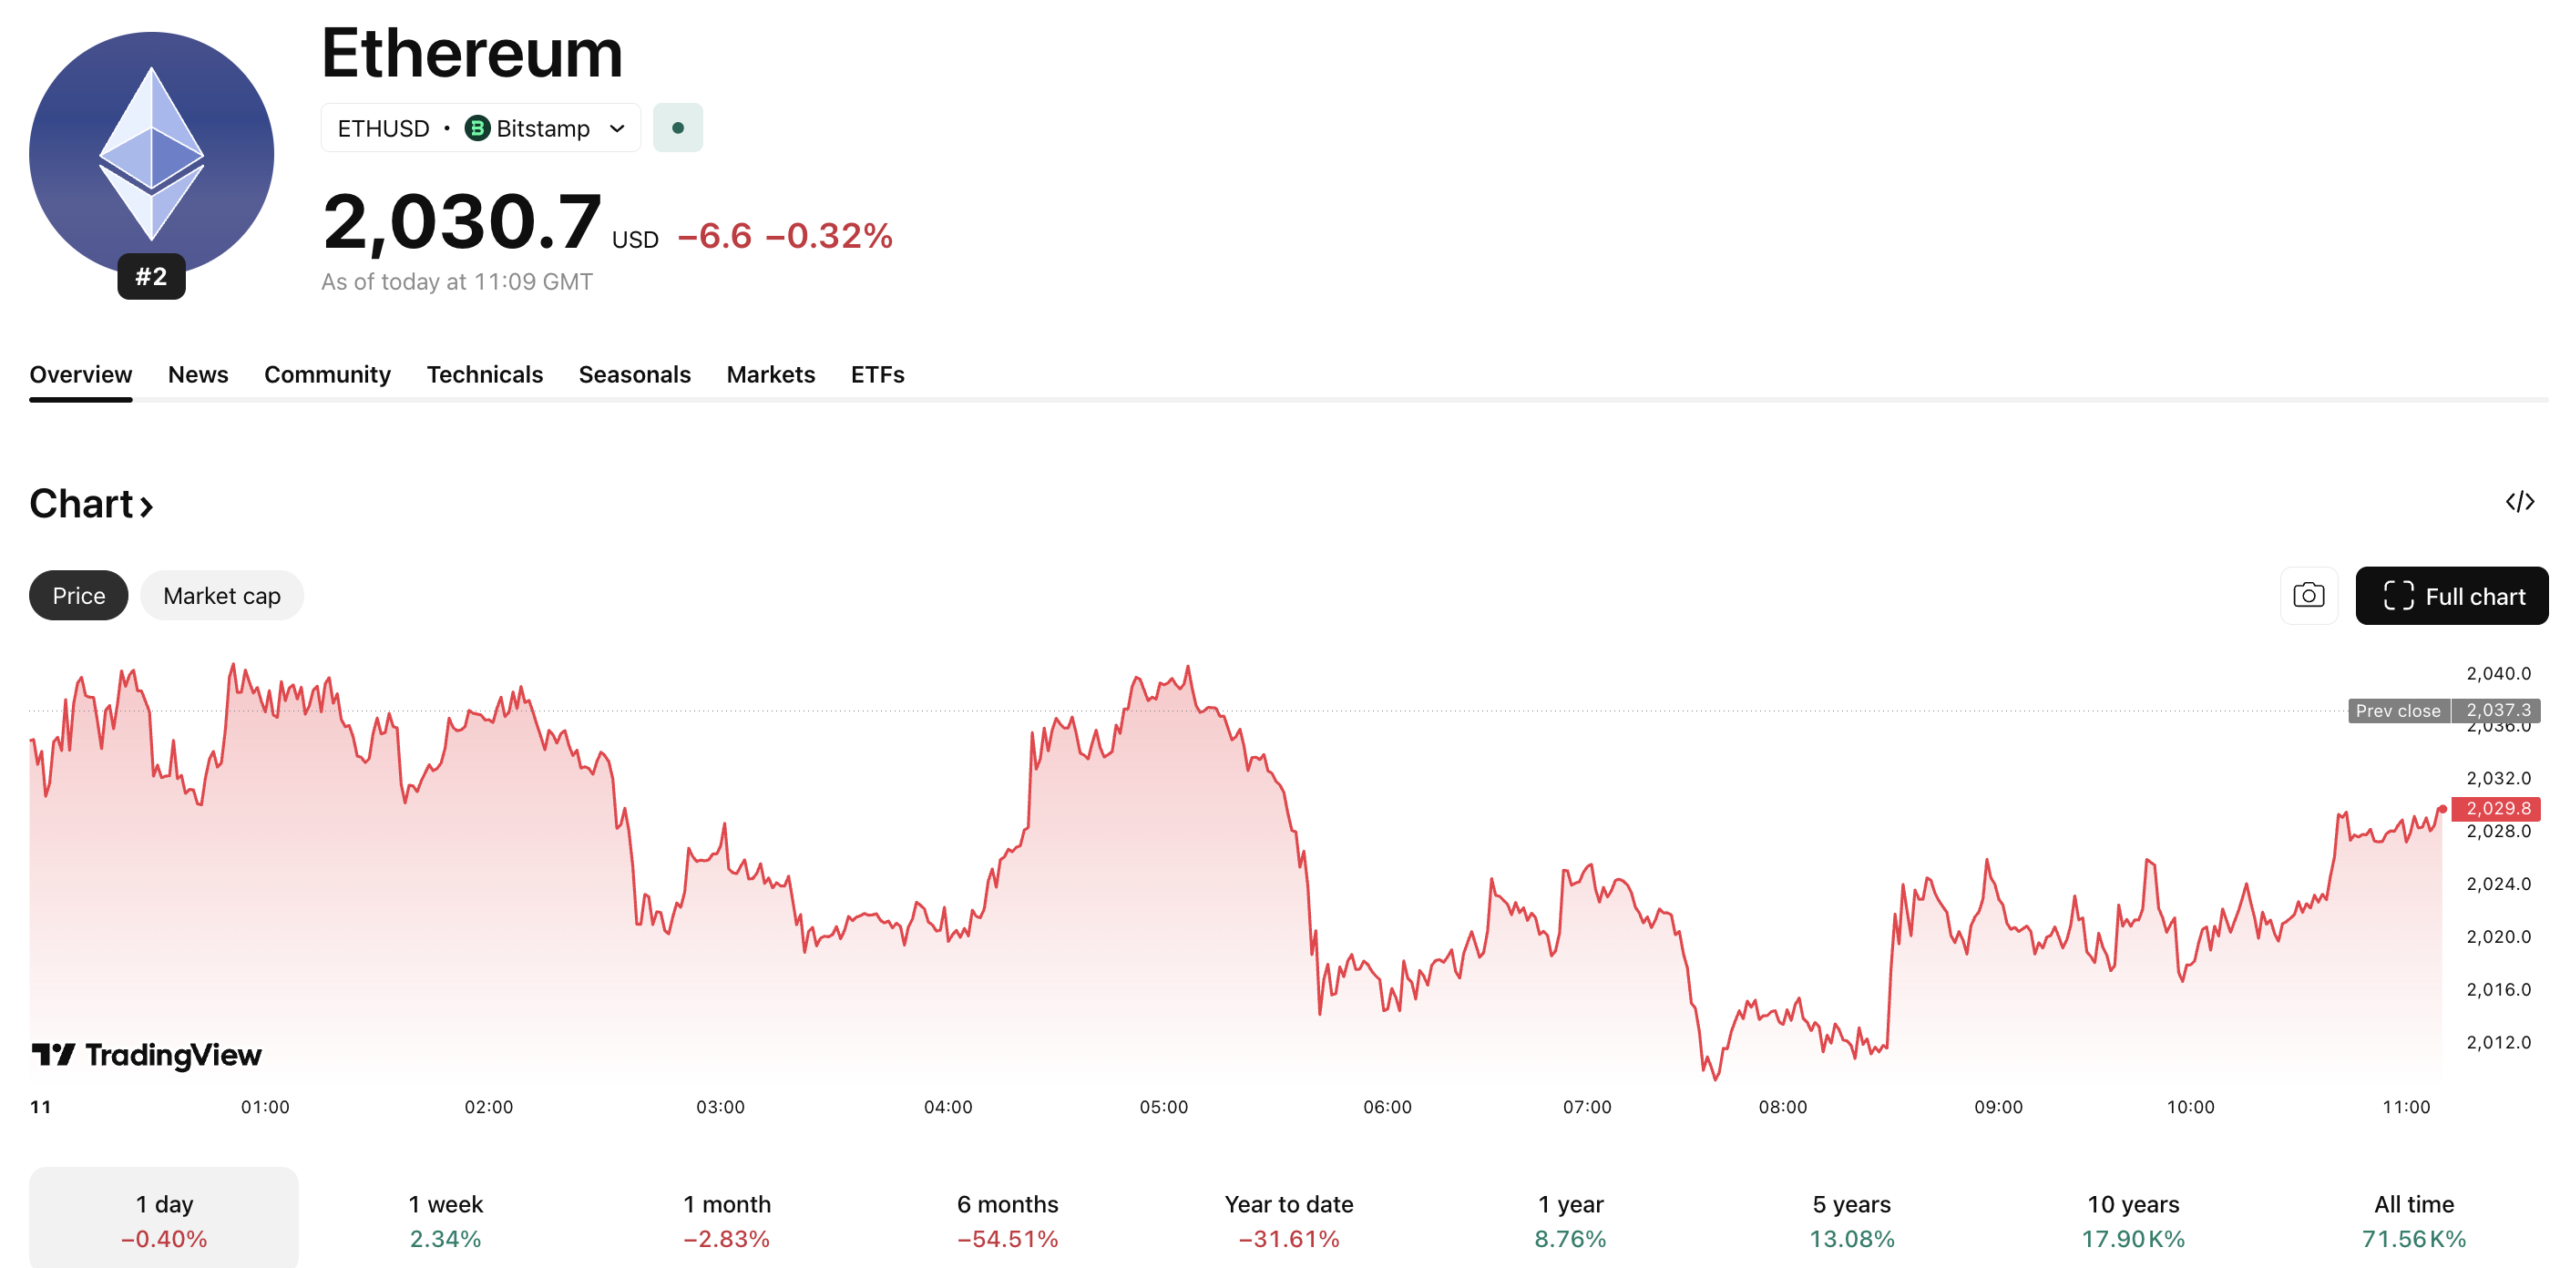
The tension is mounting as on-chain utilization explodes while market valuation compresses. While smart contract calls top 40 million daily, the one-year change in Ethereum’s realized capitalization has turned negative, signaling net capital outflows.
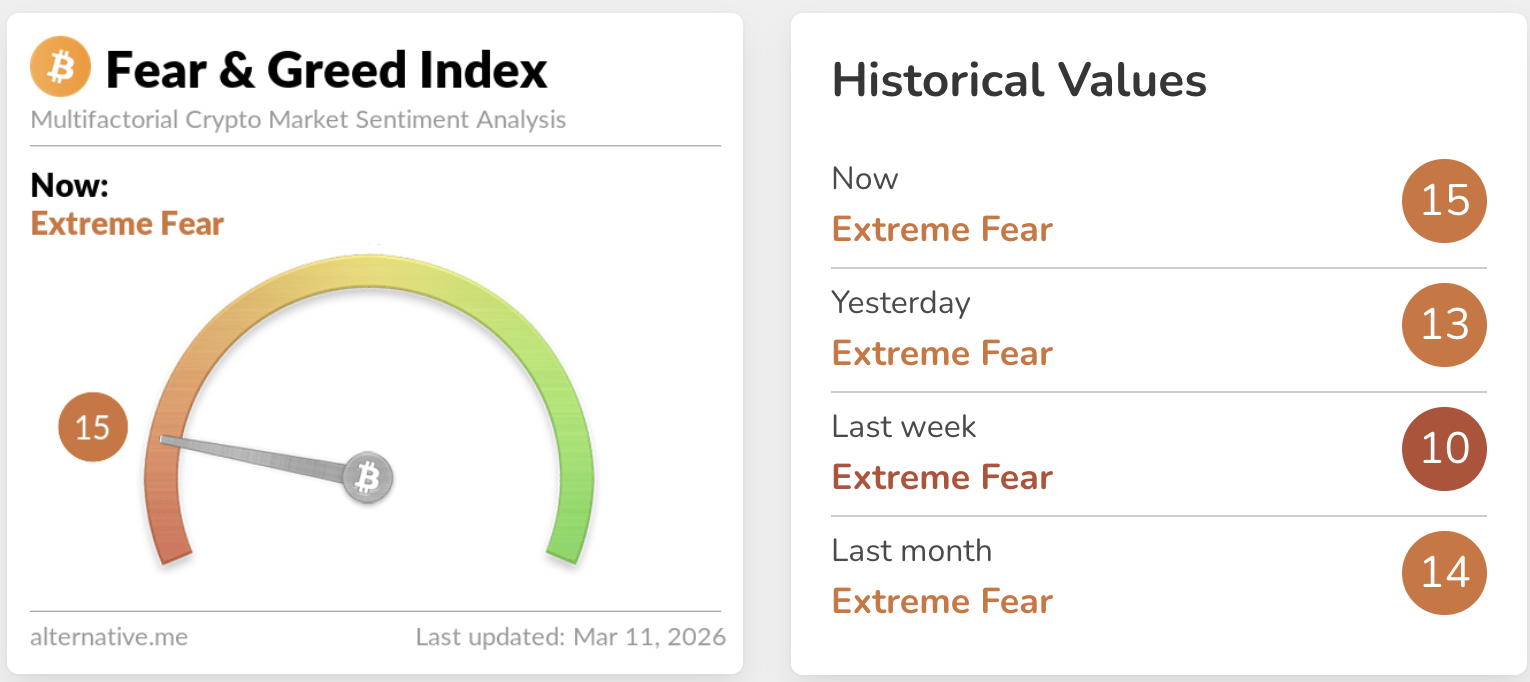
This contradiction suggests a massive repricing event is imminent, though the direction remains the subject of fierce debate among analysts tracking the Fear & Greed Index, which currently sits at 15/100, firmly in the ‘Extreme Fear’ zone.
The On-Chain Disconnect: Is the Market Ignoring Fundamentals?
The gap between utility and value is at its widest, with on-chain transactions exceeding 40M per day, marking the network’s busiest period ever.
Typically, this level of activity signals an upcoming price increase. In past cycles, especially in 2018 and 2021, rising on-chain activity often preceded price rallies.
However, this time is different; recent data shows high activity levels but low prices, suggesting that while the financial network is heavily utilized, the speculative premium has faded.
Bulls view this as a classic accumulation setup. With Ethereum’s usage at an all-time high and prices low due to negative sentiment, a supply shock may occur as locked ETH leaves circulation just as demand spikes. The market may still be slow to recognize the value of this activity, potentially leading to a significant price surge.
DISCOVER: Top Crypto Presales to buy in March
The Bear Case: Validating the Revenue Gap
However, the bears have a potent counterargument centered on revenue capture. While activity is up, base layer fees are down, largely due to the migration of volume to Layer 2 solutions.
Data from DefiLlama shows Ethereum USD generated roughly $10.3M in transaction fees over the past 30 days, a figure that pales in comparison to Tron’s nearly $25M and Solana’s $20M.
This fee depression is structural, not accidental. Base, the Layer-2 network built by Coinbase, generated nearly three times Ethereum’s protocol revenue over the same period.
Traders should also note the technical ceiling. The chart currently shows ETH consolidating in a tightening triangle pattern.
If the revenue narrative continues to dominate sentiment, the path of least resistance could be a test of the $1,746 support level, which would likely flush out remaining weak hands before any sustainable reversal can occur.
What to Watch: The Breakout Levels for Ethereum USD
Traders need to keep their eyes locked on the $2,396 level. A daily close above this resistance would confirm that the market is finally pricing in the record network activity, likely triggering a squeeze on short positions.
Conversely, failure to hold the $2,000 psychological support would validate the bear thesis regarding fee revenue, opening the trapdoor toward $1,746.
The powder keg is built, and all that is missing is the spark. Watch for a reversal in ETF flows or a spike in base layer gas fees to signal that the rotation back into ETH has officially begun.
Until then, the market remains in a precarious accumulation zone where patience is the only hedge against volatility.