


Dual Bleed: BTC and ETH ETFs Both Post Outflows as Ethereum’s Inflow Streak Snaps
U.S. spot Bitcoin ETFs shed $95.3M and Ethereum ETFs lost $52.1M on July 9, snapping a five-day ETH inflow streak in a rare dual-product redemption day.

U.S. spot Bitcoin ETFs posted $95.30 million in net outflows on July 9, according to data reported by Wu Blockchain – a single-session redemption print that arrived alongside $52.08 million in net outflows from spot Ethereum ETFs, ending a five-day inflow streak for the ETH complex.
Both BTC and ETH ETFs Bleed on the Same Session
The simultaneous drawdown across both asset wrappers is the headline signal from July 9 flows data. For Ethereum ETFs, the break is sharper in narrative terms: five consecutive sessions of net inflows had pointed to a stabilisation in institutional demand, making the $52.08 million single-day reversal a clean sentiment flip rather than a continuation of an established trend.
For Bitcoin ETFs, the $95.30 million outflow fits a pattern that has defined much of 2026. The U.S. spot Bitcoin ETF complex – which accumulated tens of billions in assets under management following its January 2024 launch – has been grinding through a sustained redemption cycle. The first half of 2026 recorded approximately $5.4 billion in net outflows, marking the first semi-annual period of net redemptions since the products launched, per tracking data cited in recent flow analysis covered by CoinNews on the broader ETF outflow trend running through early 2026.
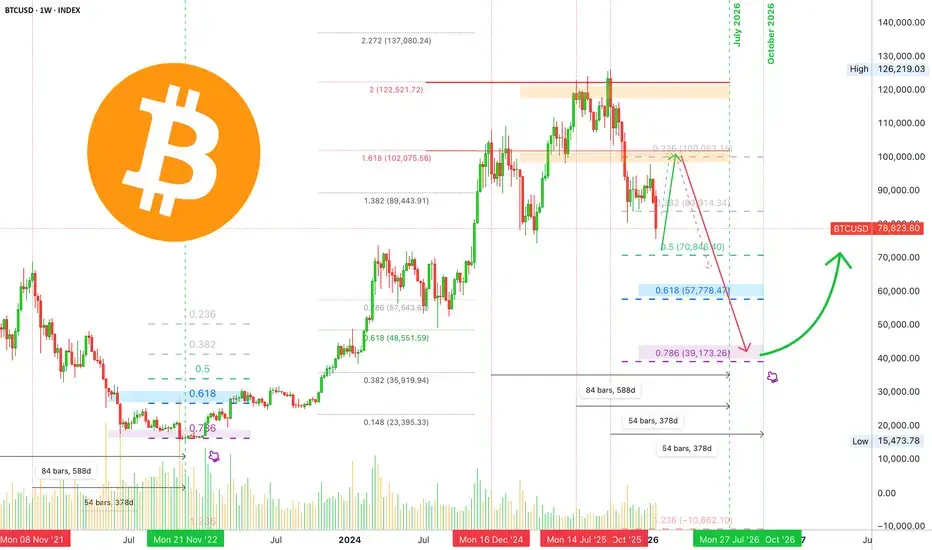
The July 9 session alone does not collapse the cumulative picture – total net asset value across U.S. spot Bitcoin ETFs remains substantial, with cumulative net inflows since inception still running well above $50 billion on a historical basis. But each outflow session chips at the margin, and back-to-back bleed across both BTC and ETH products in the same trading day reinforces that this is not isolated profit-taking in a single wrapper.
Ethereum’s Streak Break Carries Its Own Weight
The Ethereum ETF story deserves a separate read. The five-day inflow run that ended July 9 had been one of the few constructive data points in an otherwise difficult first half for the ETH product complex. Over the 123 trading days that made up H1 2026, spot Ethereum ETFs logged $1.47 billion in net outflows, with outflow days outnumbering inflow days 73 to 49, according to flow tracking data from SoSoValue.

Cumulative net inflows into Ethereum ETFs had fallen to approximately $10.9 billion by mid-2026 – down roughly 28% from a peak of $15.1 billion recorded in October 2025. The five-session inflow streak that just ended had represented a potential floor-test; the $52.08 million July 9 outflow suggests that test has not yet resolved in bulls’ favour.
For context on how to read these BTC and ETH flow prints side by side, the mechanics and market implications of dual-product ETF redemptions have been documented in earlier CoinNews analysis of how BTC and ETH ETF flows interact across custody and prime brokerage infrastructure.
Structural Backdrop: Capital Rotating Away from Crypto ETFs
The July 9 outflows do not exist in isolation. The macro rotation framing has gained traction among institutional research desks tracking fund flows across asset classes: gold-linked ETFs attracted an estimated $16 billion in net inflows over a three-month window in early 2026, while AI-linked equity funds captured sustained institutional attention that crypto products have not matched in recent quarters.

The implication is structural rather than tactical. When large pools of capital rotate out of crypto ETFs into alternative risk exposures – gold, AI equities, cash-equivalent instruments – the redemption pressure does not reverse on a single session of positive price action. It reverses when the return profile of holding BTC or ETH through an ETF wrapper again clears the threshold against competing opportunities.
Earlier in 2026, the Bitcoin ETF complex experienced a stretch where outflows ran for eight consecutive weeks – a streak tracked in detail in CoinNews’s analysis of the eight-week outflow run, which identified macro re-rating rather than cyclical sentiment noise as the governing mechanism. The July 9 session is consistent with that read; single-day outflows in the $95 million range are not shock events in themselves, but their persistence compounds.
The sharpest weekly shock in recent memory saw U.S. spot Bitcoin ETFs shed $1.33 billion in net outflows across a single four-day trading week – the worst weekly performance since February 2025 – while Ether ETFs lost $611 million in the same window, reversing a prior inflow streak that had lasted long enough to generate genuine optimism about a trend change. That precedent matters: inflow streaks have repeatedly reversed on a single-session shock, which is exactly what the July 9 ETH data prints.
What the Flow Data Signals Going Forward
ETF flows have become the primary institutional sentiment gauge for both BTC and ETH – more granular than price alone, and more forward-looking than on-chain accumulation metrics that lag by days. Persistent net outflows signal that large allocators are trimming exposure at the margin, not rotating between crypto assets, but reducing overall crypto weight. That is a materially different dynamic than short-term traders taking profit.
The near-term signposts are clear. For Bitcoin ETFs, the question is whether the H1 2026 outflow cycle – now totalling over $5 billion in net redemptions – represents a structural de-risking plateau or a trend that continues to accelerate. For Ethereum ETFs, the more immediate question is whether the five-day inflow streak that just ended was a genuine floor or a temporary interruption inside a longer bleed.
A prior reversal from sustained outflows back to net inflows was examined in depth when the Bitcoin ETF complex briefly snapped an earlier multi-week redemption streak – the mechanics of that shift, and why it did not sustain, are documented in CoinNews’s coverage of the brief inflow window that ended the prior outflow run. That episode is the relevant comparison set for reading whatever comes next from July’s flow data.
Upcoming semi-annual and quarterly flow reports will clarify the scale and duration of 2026’s redemption cycle. The more immediate signal will come from the daily flow prints in the sessions following July 9: whether the ETH inflow streak resumes or the break deepens, and whether Bitcoin’s outflow pace accelerates, holds, or reverses. The path of least resistance for both products remains lower in flow terms until a sustained inflow streak – not one of five sessions – demonstrates that institutional capital is returning at scale. The market will be forced to price that distinction as the data accumulates.
Follow CoinNews on X and Telegram for daily ETF flow updates and institutional crypto market analysis.




