Bitcoin Price Prediction As Gold And Silver Hit All-Time Highs, Is BTC Next?

The Bitcoin price rose 1.2% in the past 24 hours to trade at $89,043 as of 2:58 a.m. EST on trading volume that soared 77% to $28.9 billion.
The surge comes as gold jumped past the $4,400-per-ounce level for the first time, riding growing expectations of further US rate cuts and strong safe-haven demand, with Silver also hitting a new all-time high (ATH).
Gold hit an ATH of $4,420.01/oz, while silver reached $69.44/oz.
As BTC languishes below its ATH, analysts are now concerned that speculative assets may be entering a prolonged downturn.
Market Strategist Charlie Bilello highlighted that since January 2024, when the first Bitcoin ETF debuted, gold has outperformed Bitcoin by 19%.
Meanwhile, BTC permabears, including Peter Schiff, have indicated that Bitcoin’s price could now drop to around $5,000 after gold broke out of its recent consolidation zone.
Can the recent Bitcoin jump lead to a rally?
Bitcoin Price Stands At A Crossroads
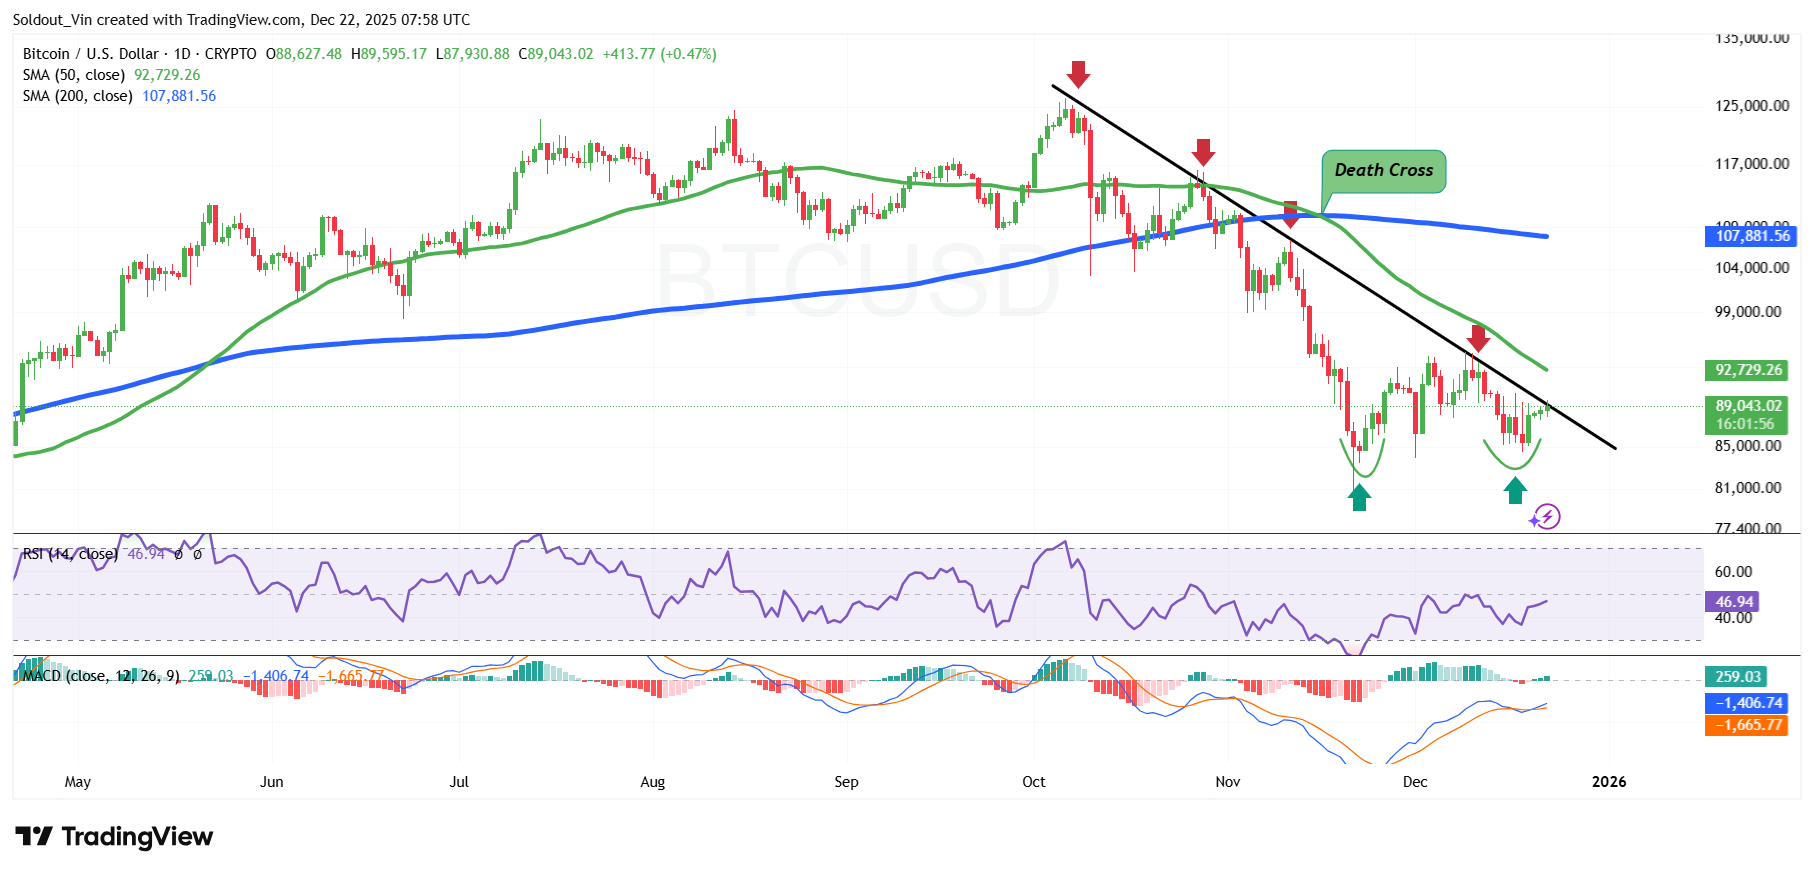
After a surge early in the year that pushed the BTC price to an all-time high of around $126,200 in October, the asset then went through a correction. BTC bears used the subsequent supply areas around $115,000, $107,700, and $94,000 to sustain the negative pressure.
Bitcoin traders are now on high alert as the cryptocurrency’s daily chart flashes a classic death cross, a bearish technical signal that has dominated headlines in the volatile crypto market.
The pattern occurred when Bitcoin’s 50-day Simple Moving Average (SMA) crossed below the 200-day SMA, with the 50-day SMA at approximately $92,729 and the 200-day SMA at roughly $107,881. This crossover, visible in the mid-to-late portion of the chart, signals weakening short-term momentum against the longer-term trend.
The downward trendline from Bitcoin’s price ATH also paints a cautious picture for the world’s largest digital asset.
Despite a slight daily gain of 1.2%, Bitcoin’s price remains well below its ATH of over $126,000, reflecting a broader correction that has seen BTC shed roughly 29% from those peaks.
Momentum indicators also add to the mixed sentiment, as the Relative Strength Index (RSI) is still trading within an equilibrium, but showing signs of a rebound as it closes in on the 50-midline level, currently at 46.
Meanwhile, the Moving Average Convergence Divergence (MACD) has flagged some bullish outlook, as the blue MACD line has crossed above the orange signal line. The green bars on the histogram also show some developing positive momentum.
BTC Price Outlook
Based on the BTC/USD chart analysis, the BTC price appears mildly bullish, but remains capped below the falling trendline.
If BTC breaks above the $90,000 psychological barrier, the next key target will be the 50-day SMA at $92,729, which the double bottom could support.
Sentiment stays cautious as the Crypto Fear and Greed Index sits at 27–29, signaling “Fear.” Historically, such low readings often mark buying opportunities before rebounds.
Conversely, if the bears act on Bitcoin at this level, the next key support area in the coming days will be the $82,000 zone.
According to Ali Mertinez, a prominent analyst on X, BTC is currently testing the mid-range at $89,000.
This level places Bitcoin’s price at a crossroads; if it breaks it, the next key resistance levels will be around $91,000 and $93,000. A break below that zone could send BTC to $84,000.