


XRP Rally Hits $1.6963 as Momentum Collides With Reversal Risk
XRP price reaches $1.6963 as ETF inflows and whale buying support the rally, while an overbought RSI signals possible pullback risk.

XRP spiked to $1.6963, its highest level since January of the prior year, marking a sharp recovery from its year-to-date low of $0.9870 as whale accumulation and rising ETF inflows collided with a broader crypto risk-on move. The rally pushed the token’s Relative Strength Index to 85.4, its most overbought reading since July of last year, according to Benzinga reporting.
ETF Demand and Whale Buying Fuel the Move
The rally coincided with top coins including Bitcoin, Ethereum, and Cardano all reaching multi-month highs, while the Crypto Fear and Greed Index jumped to 73, its highest reading in months and firmly inside the greed zone. That backdrop gave XRP room to run once its own catalysts kicked in.
XRP spot ETFs pulled in more than $18 million in inflows on Friday alone, lifting weekly inflows to $40 million – the largest weekly haul since May. The Bitwise and Franklin XRP ETFs added $12.2 million and $1.49 million respectively on the day, pushing their net assets to $442 million and $433.8 million. This kind of steady institutional bid lines up with the broader trend covered in recent XRP ETF inflow coverage, where allocator demand has repeatedly served as an underlying support layer beneath price action.
On the supply side, whales have continued pulling tokens off exchanges, with more than 240 million XRP withdrawn since the start of summer – a signal that larger holders are positioning for a longer hold rather than a quick exit. XRP Ledger fundamentals are reinforcing that conviction: the Ripple USD stablecoin’s market capitalization hit a record $2.1 billion, up from a January low of $1.5 billion, pointing to expanding usage on the network itself.
XRP Technical Structure Turns Extremely Overbought
The daily chart shows XRP forming a large falling wedge before rising. The move carried price above the 50-day Exponential Moving Average, confirming that bulls had regained short-term control of the chart.
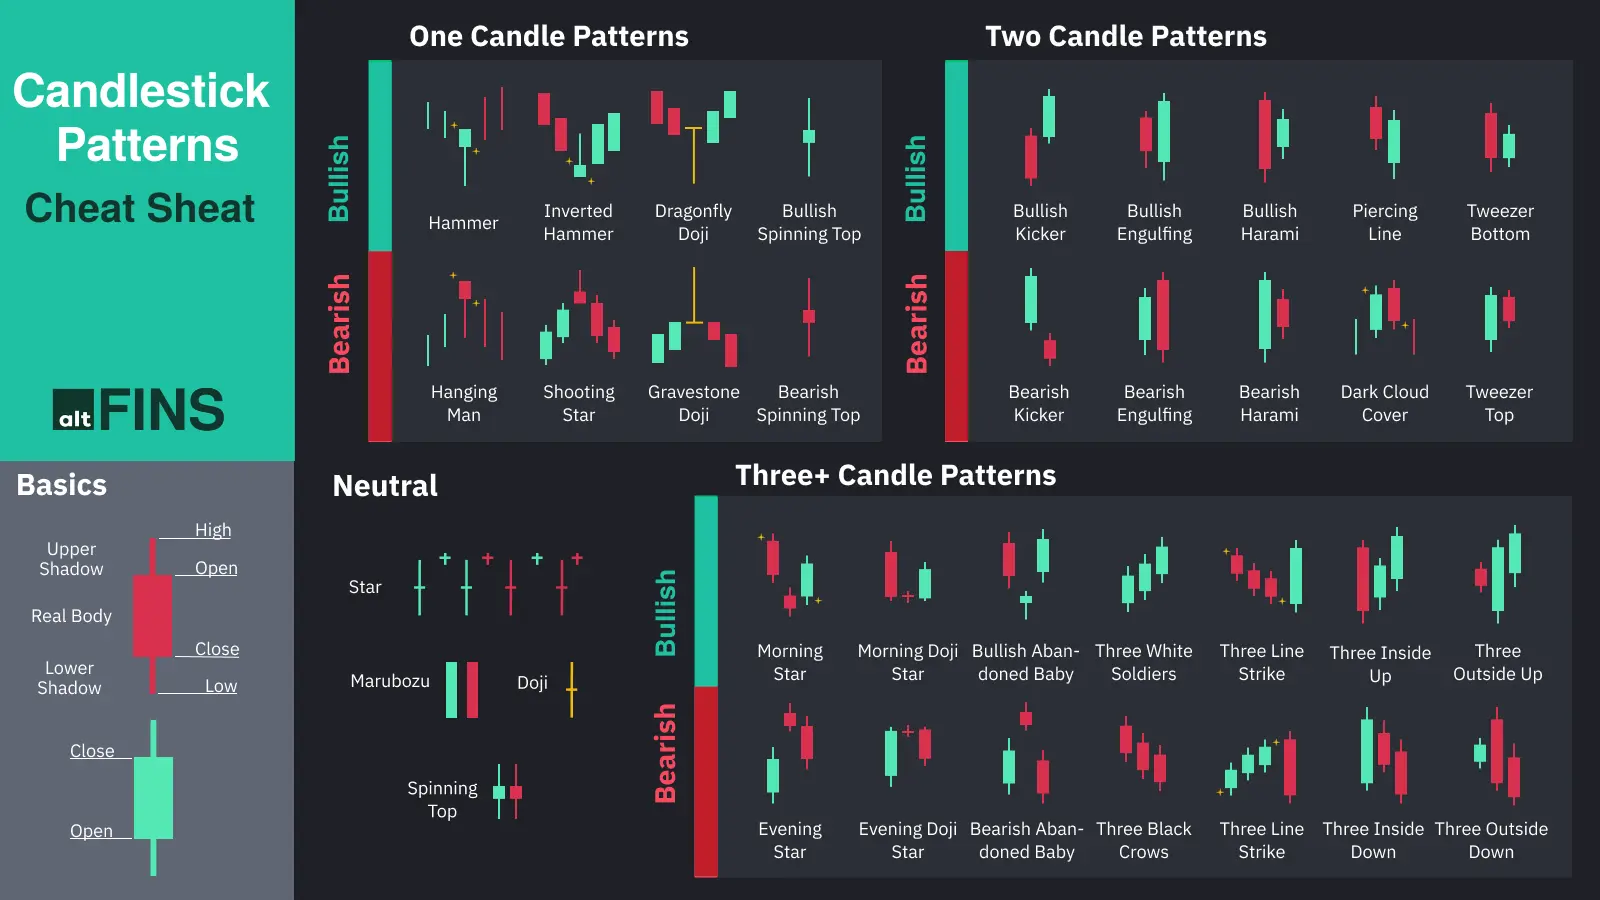
The complication is the RSI reading of 85.4, the highest level since July of last year and firmly in territory that has historically preceded at least a short-term cooling-off period. Compounding that risk, the daily candle is showing signs of forming either a doji or a shooting star – both classic reversal signals that traders watch for confirmation of exhaustion after a sharp run.
XRP Bearish Scenario: A Pullback to $1.1580
If the overbought reading resolves the way it typically has in prior cycles, XRP risks a corrective move back toward $1.1580, which marked the token’s high point in July of this year and was identified as a potential support level. A confirmed doji or shooting star close would strengthen the case for that retracement, and a breakdown below the reclaimed 50-day EMA would open the door to a deeper pullback toward the broader support structure detailed in this XRP support-level breakdown.
XRP Bullish Case: Momentum Holds Above the EMA
The bullish counterpoint is that the falling wedge breakout, sustained ETF inflows, and continued exchange outflows represent structural demand that doesn’t unwind overnight. As long as XRP holds above its 50-day EMA and ETF inflows keep printing green weeks, the overbought RSI reading may simply consolidate sideways rather than trigger a sharp reversal – a scenario examined further in this XRP price target outlook for the current quarter. A sustained close above $1.6963 would put the token in territory it hasn’t traded at in well over a year, with little in the way of established resistance until the market finds its next equilibrium.
Follow CoinNews on X and Telegram for continuing XRP price coverage.




