Bitcoin Price Slides Even as Strategy Doubles Down on Its BTC Buying Plan

The Bitcoin price slumped by a fraction of a percentage in the past 24 hours, trading at $84,518, amid a 34% daily trading volume surge to $125.4 billion.
The drop in BTC comes despite Michael Saylor’s firm, Strategy, reaffirming its plan to keep buying Bitcoin even as prices fall. The company said in an X post that it will follow the same approach it used during the 2022 crypto winter, when it kept accumulating BTC even while its holdings were deep in loss.
Strategy has bought Bitcoin every week this month, including an 8,178 BTC purchase last week—its biggest since July. The firm now holds 649,870 BTC at an average price of $74,433. But with Bitcoin trading just above $80,000, the company risks seeing its holdings slip below its cost basis again, especially with analysts like Peter Brandt warning that BTC could fall to $58,000.
Saylor remains confident and says the company’s long-term strategy and conviction in Bitcoin are unchanged, even as it faces possible removal from MSCI indices.
However, Bitcoin critic Peter Schiff disagrees. He says it is unrealistic for Strategy to survive an 80%–90% crash and argues that shareholders would not accept such massive losses. Schiff has repeatedly called Strategy’s business model a “fraud” and claims the company could eventually go bankrupt.
Bitcoin Price Drops Toward Major Support as Oversold Signals Hint at Possible Bounce
Bitcoin is trading around $84,657 and remains under strong selling pressure. The price has been falling for weeks after breaking out of a bearish channel, showing that sellers are still in control. The main trend turned bearish when BTC failed to stay above the resistance zone near $126,000–$130,000, which triggered a big reversal.
A key signal on the chart is the moving average cross. The 50-day SMA has crossed below the 200-day SMA, forming a death cross. This is a strong bearish signal that usually points to more downside. Bitcoin is also trading well below both moving averages, which shows that momentum is weak and buyers are not strong enough yet.
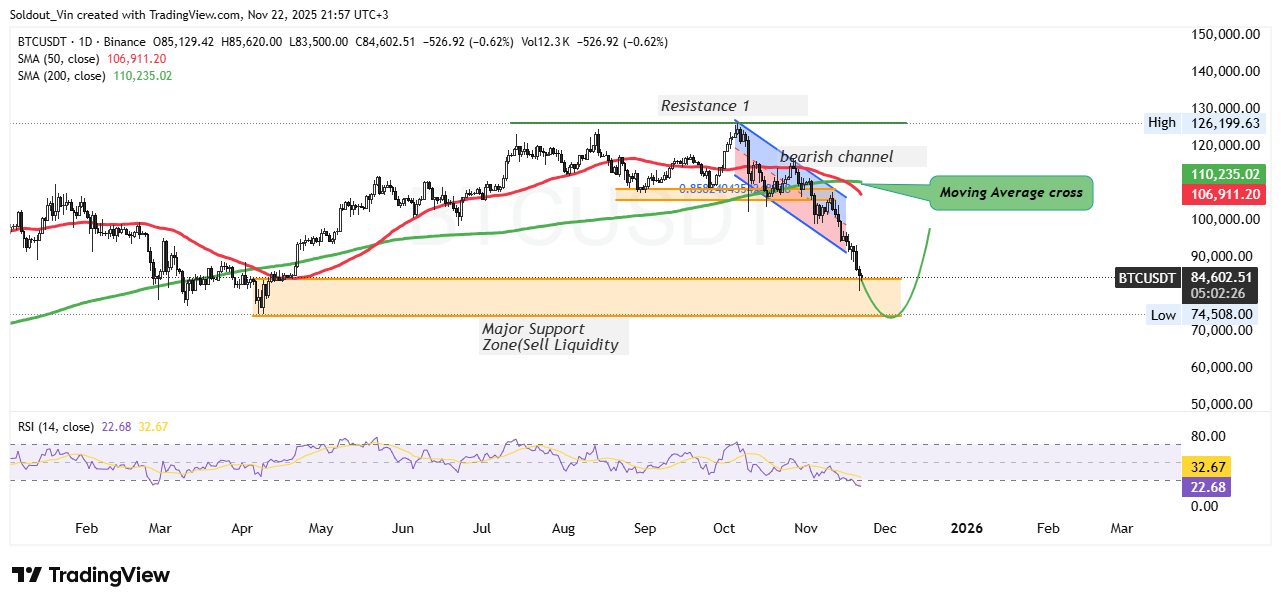
BTCUSDT Daily Chart Analysis. Source: Tradingview
BTC is now moving toward a major support zone between $70,000 and $75,000. This area was a big demand zone earlier in the year, where buyers entered aggressively. The chart suggests that Bitcoin may bounce if it reaches this zone again. The green curve shows a possible recovery path if buyers defend this area.
The RSI (14) is at 22.73, which is extremely oversold. This means the market has been selling too aggressively, and a short-term bounce or relief rally is likely. Oversold RSI has often marked the beginning of short-term recoveries, but the price still needs to show strong bullish candles before confirming a reversal.
If Bitcoin starts to recover, the first resistance will be around $95,000–$100,000. The next major resistance sits near the moving averages at $106,000–$110,000, which could be hard to break. BTC must reclaim these levels for the trend to shift back to bullish.


