Bitcoin Cash Price Soars 10% As Weaker US CPI Boosts Sentiment Even As Japan Hikes Rates
The Bitcoin Cash price soared 10% in the past 24 hours to trade at $588.91 as of 4:17 a.m. EST on trading volume that skyrocketed 90% to $627 million.
Market sentiment was boosted by softer-than-expected US Consumer Price Index (CPI) data for November.
Inflation rose 2.7% from a year earlier, compared with a 3.1% consensus, boosting hopes that the Federal Reserve will have more room to cut rates next year.
Core inflation came in at just 2.6% versus a consensus of 3%.
Meanwhile, Japan’s central bank hiked its benchmark interest rate to the highest level in 30 years.
In a widely expected decision, the Bank of Japan’s (BOJ’s) policy board, led by governor Kazuo Ueda, increased the rate by a quarter of a percentage point to 0.75%.
Despite that, the yen fell 0.25% at 155.94 against the dollar.
Bitcoin Cash Price Analysis: Bulls Attempt Breakout After Corrective Channel
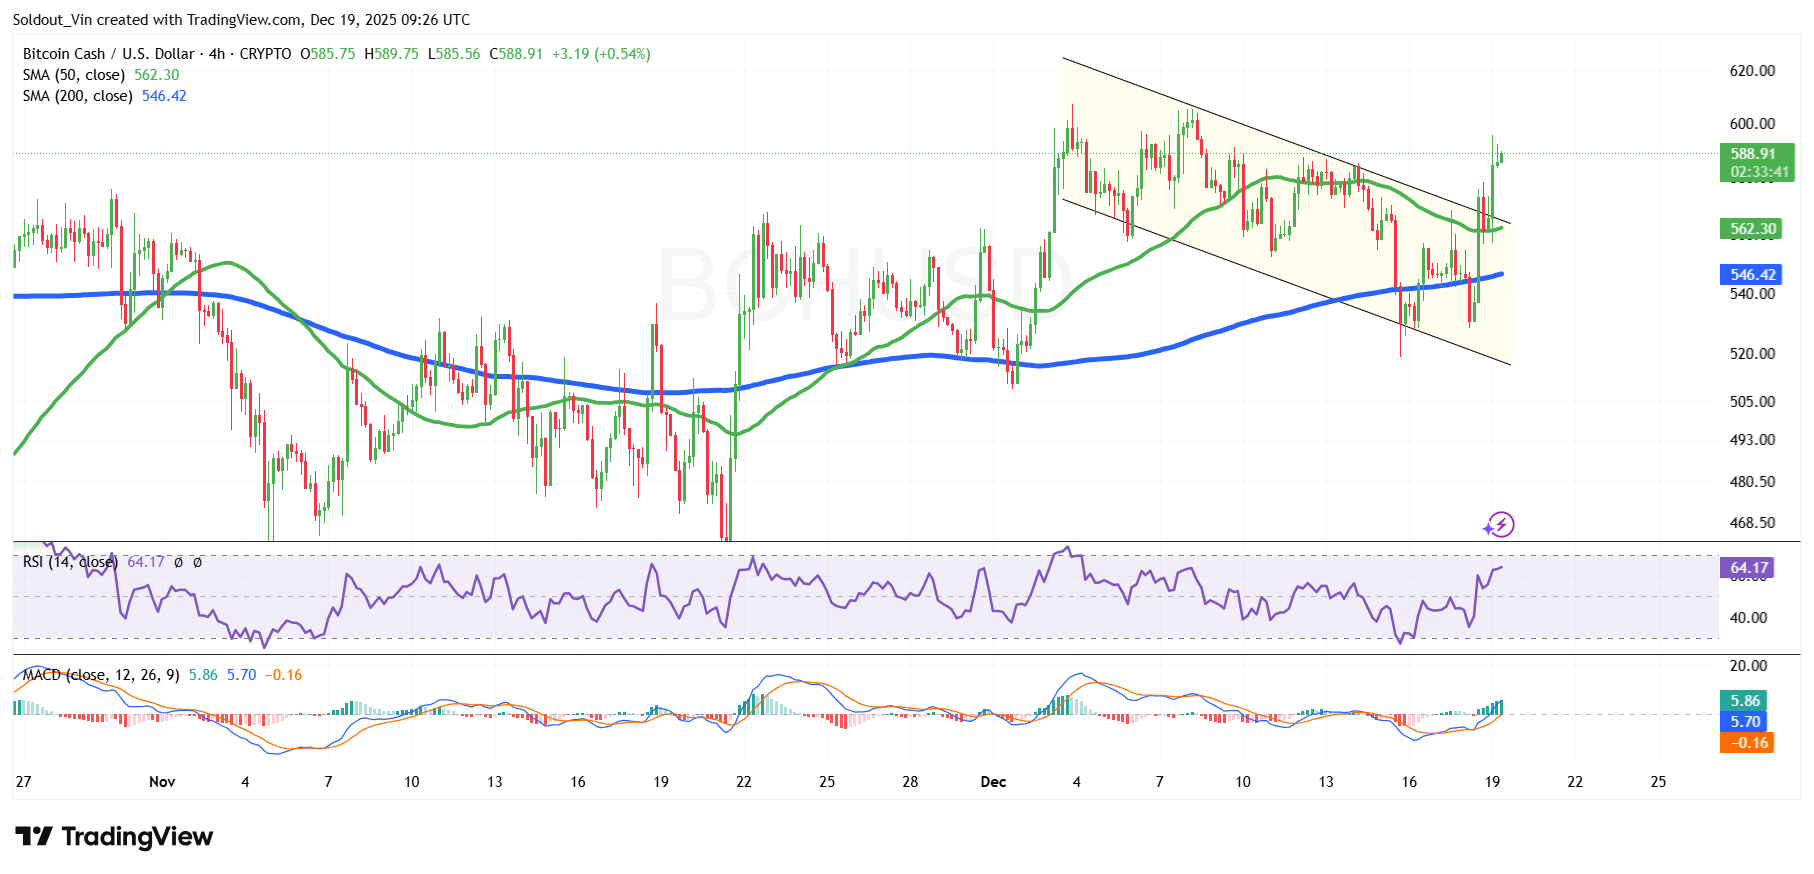
The BCH price recently experienced a strong upside move before entering a corrective phase, where it traded inside a falling channel pattern on the 4-hour chart.
During the correction, the Bitcoin Cash price respected key Simple Moving Averages (SMAs) and avoided a deeper breakdown, signaling that buyers were still active at lower levels.
Bitcoin Cash is currently trading around $588, holding above both the 50-day Simple Moving Average (SMA) at $562 and the 200-period SMA at $546. These levels are critical, as they previously acted as dynamic support zones during the pullback.
Momentum indicators also support this outlook. The Relative Strength Index (RSI) has climbed to around 64, indicating strengthening bullish momentum while remaining below overbought territory. This suggests there is room for further upside.
Meanwhile, the Moving Average Convergence Divergence (MACD) on the 4-hour chart shows a bullish crossover, with the MACD line moving above the signal line and the histogram turning positive. This points to improving momentum following the consolidation phase.
BCH Price Could Target $600–$620 If Momentum Holds
According to the BCH/USD chart analysis, Bitcoin Cash could continue its upward move if buyers maintain control above key SMAs.
On the upside, immediate resistance sits near the $600 psychological level, followed by the previous swing high zone between $610 and $620. A clean break above these levels could confirm a continuation of the broader bullish trend.
Conversely, if the BCH price drops, the first major support lies at the 50-day SMA near $562, followed by the more critical 200-day SMA around $546.
A sustained move below the 200-day SMA would weaken the bullish structure and could open the door for a deeper retracement toward the $520–$530 region.


