


Bitcoin Holds $87K After $178M ETF Outflows Amid Christmas Day Market Recovery

The Bitcoin price edged up over 1% in the past 24 hours to trade at $87,764 as of 2:10 a.m. EST on trading volume that dropped 47% to $25.1 billion.
The crypto market has seen a modest Christmas Day recovery, which has seen its market capitalization rising 1% to $3.04 trillion.
However, data from Coinglass shows that US spot Bitcoin exchange-traded funds (ETFs) recorded total net outflows of $175 million. The BlackRock spot BTC ETF (IBIT) saw the largest single-day net outflow with $91.37 million.
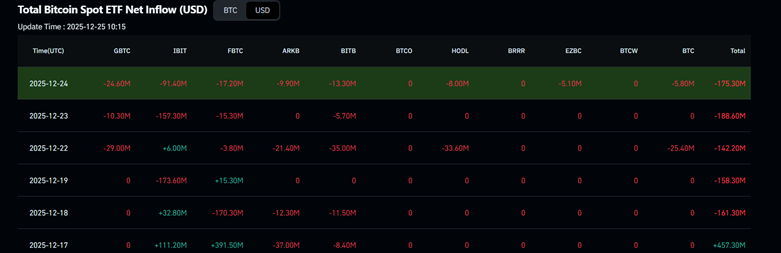
This marks the fifth consecutive day of net outflows, showing a week of uncertainty among these products.
Meanwhile, BTC continues with its sideways trajectory, trading between the $86,000 – $87,000 levels. Bitcoin has also been hovering within the $80,000-$94,000 levels since the late November correction, failing to break out of its one-month range despite earlier attempts.
Can the recent surge be a signal of a recovery in the coming days?
Bitcoin Price Compresses As Market Awaits Directional Breakout
Following a sharp rejection from the $110,000–$115,000 region earlier in November, the BTC price entered a sustained corrective phase that dragged the asset toward the lower $80,000s.
This decline marked a clear shift in market structure, as buyers failed to defend higher levels and sellers gradually took control. The selling pressure eventually eased near the $83,000 support zone, where demand began to stabilize the market.
Despite this relief bounce, the Bitcoin price has not been able to establish a meaningful recovery.
Instead, BTC has tightened into a symmetrical triangle pattern. This formation reflects shrinking volatility and growing indecision.
Trend indicators continue to favor the bears. The 50-day Simple Moving Average (SMA) on the 6-hour chart remains below the 200-day SMA, reinforcing the broader bearish bias.
Momentum indicators echo this uncertainty. The Relative Strength Index (RSI) is hovering near the 49 level, placing BTC firmly in neutral territory. This reading indicates a balance between buying and selling pressure, with neither side showing clear dominance.
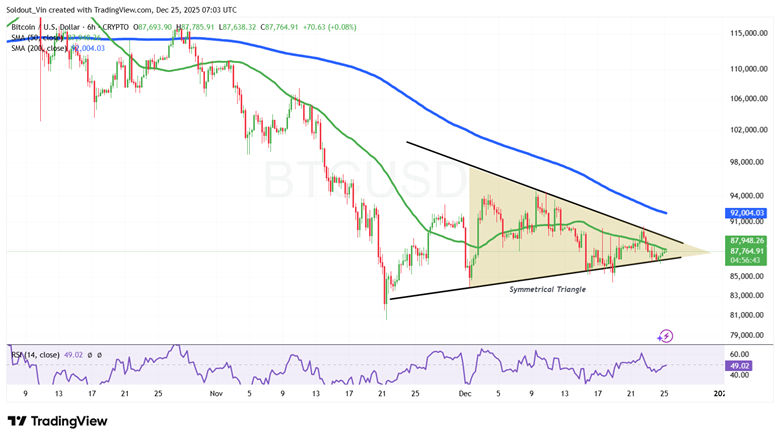
BTC/USD Chart Analysis: TradingView
BTC Price Prediction
Based on the BTC/USD 6-hour chart, the BTC price is approaching a pivotal decision point. A confirmed breakout from the triangle structure is likely to define the next short- to medium-term trend.
If the price of BTC breaks below the triangle’s lower boundary around $85,000, bearish continuation could follow, with the $83,000 support acting as the next key defense. Failure to hold this zone may expose the market to a deeper decline toward the psychological $80,000 level.
On the other hand, a strong bullish breakout above $89,000 could open the door for a recovery rally toward the 200-day SMA near $92,000. However, only a sustained move above this level would signal a meaningful shift for the Bitcoin price away from the prevailing bearish structure.
About Author

About Author




