Bitcoin Holds Steady Around $87K as Arthur Hayes Predicts Support at $80K and Future Rally

The Bitcoin price climbed by a fraction of a percentage in the past 24 hours, trading at $87,718, amid a 12% daily trading volume surge to $71billion.
This comes as BitMEX co-founder Arthur Hayes has once again shared his outlook on Bitcoin as the cryptocurrency continues to trade around the $80,000 level. Hayes believes the bottom is already in and expects BTC to hold above the key $80,000 support, though he warns of one more brief dip into the low $80,000 region due to choppy price action. He also thinks Bitcoin could soon retest major resistance levels, with a stronger “bazooka” rally likely happening next year.
Hayes pointed to improving liquidity as a major positive for BTC. He noted that the Federal Reserve will end quantitative tightening on December 1 by stopping its balance sheet run-off, while U.S. banks have recently increased lending. Both developments, he said, are boosting market liquidity.
Last week, Hayes explained that Bitcoin’s drop to $81,000 was caused by falling dollar liquidity, but he still expects liquidity to rise before year-end—supporting his prediction that BTC could reach $200,000 to $250,000. Hayes added that another Fed rate cut is not necessary for Bitcoin to recover. He said BTC surged from $16,000 to $100,000 when rates were higher, arguing that credit supply matters more than interest rates.
BTC Eyes Bullish Reversal After Bounce From $75K–$80K Support
Bitcoin (BTC/USDT) is currently trading at $88,038, showing a slight dip of 0.3% in the past 24 hours. The daily chart reveals key technical levels that traders are closely watching for potential price movement. Recently, BTC tested a major support zone between $75,000 and $80,000.
This area has historically acted as a strong floor, preventing deeper declines, and is also a significant sell liquidity zone. The recent rebound from this support suggests that buyers are stepping in, which could create upward momentum in the near term.
On the upside, BTC faces a major resistance level at $126,199, where selling pressure has previously emerged. Before reaching this level, BTC must overcome intermediate resistance around the 50-day simple moving average (SMA 50) at $104,766 and the 200-day simple moving average (SMA 200) at $110,035. These moving averages are converging, forming a potential bullish cross, which could act as a key signal if BTC manages to hold above its current support levels. A breakout above this cross could accelerate upward movement.
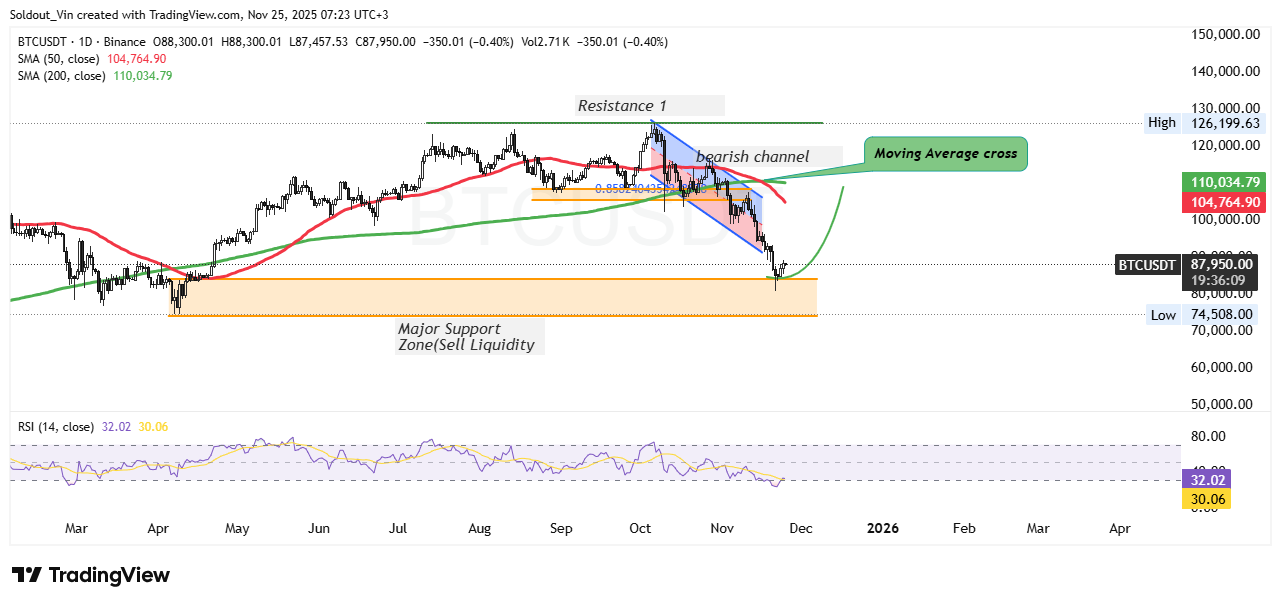
The short-term trend shows BTC trading within a bearish channel over the past few weeks, indicating downward pressure. However, the recent bounce from the major support suggests that this bearish momentum may be weakening. The Relative Strength Index (RSI) currently sits at 32.13, indicating oversold conditions. Such readings often show that selling pressure is nearing exhaustion, increasing the likelihood of a rebound. Traders frequently look at RSI levels below 30–35 as potential entry points for long positions.
If BTC holds support around $80,000 and successfully breaks above the moving averages, it could continue a bullish trajectory toward previous highs and the $126,000 resistance level. Overall, BTC is showing early signs of recovery from oversold levels, and traders should monitor the key support zone and the upcoming moving average cross for confirmation of a sustained bullish reversal. This analysis highlights critical support and resistance levels, trend channels, and RSI signals to give a comprehensive view of Bitcoin’s potential price action.


