Bitcoin Price Dips as Michael Saylor’s Strategy Buys 2,932 BTC

The Bitcoin price has dipped 1.5% in the last 24 hours to trade at $87,649 after Michael Saylor’s company, Strategy, extended its weekly Bitcoin buying streak, acquiring 2,932 BTC for $264.1 million at an average price of $90,061 per coin.
This brings Strategy’s total holdings to 712,647 BTC, purchased for $54.19 billion at an average price of $76,037 each. The company has bought over 40,000 BTC so far this year and aims to hold over 800,000 BTC by year-end. The latest purchase was funded through proceeds from selling MSTR and STRC shares.
This marks Strategy’s fifth consecutive weekly Bitcoin purchase. Last week, it acquired 22,305 BTC for $2.13 billion, becoming the first company to surpass 700,000 BTC. The dip is partly linked to concerns over a potential U.S. government shutdown.
Strategy’s MSTR Stock Dips as Saylor Reaffirms Commitment
Strategy’s stock (MSTR) also declined slightly, trading around $159, down over 2% from the previous week, though still up over 5% YTD.
Meanwhile, precious metals like gold and silver have gained attention, reaching new all-time highs above $5,000 and $100, respectively, as traders seek a hedge against fiat currency risks. Despite Bitcoin’s decline, Saylor reaffirmed his commitment to the cryptocurrency, highlighting its historical outperformance compared to gold over four-year holding periods.
He emphasized that Strategy has no plans to reduce its Bitcoin accumulation even amid the current market volatility. Strategy’s continued purchases reflect a long-term conviction in Bitcoin as a key store of value, demonstrating Saylor’s belief in BTC as “Digital Gold” despite short-term price fluctuations.
Bitcoin Shows Bullish Reversal After Hitting Major Support Zone
The Bitcoin price shows bullish reversal after testing a major support zone around $86,000–$87,000. BTC currently trades at $87,659, up 1.5% from its previous close.
The chart shows that BTC previously formed a double top pattern in mid-2025, signaling a period of resistance around $120,000. Before that, the cryptocurrency moved in a bullish channel, steadily climbing from $60,000 to above $100,000. After peaking, Bitcoin faced strong selling pressure, resulting in the current downtrend.
Currently, the major support zone between $86,000–$87,000 has held firm, preventing further declines. Technical indicators, including the Relative Strength Index (RSI), suggest that BTC is no longer oversold, trading around 40.15. The RSI rising above its previous low indicates the potential for upward momentum.
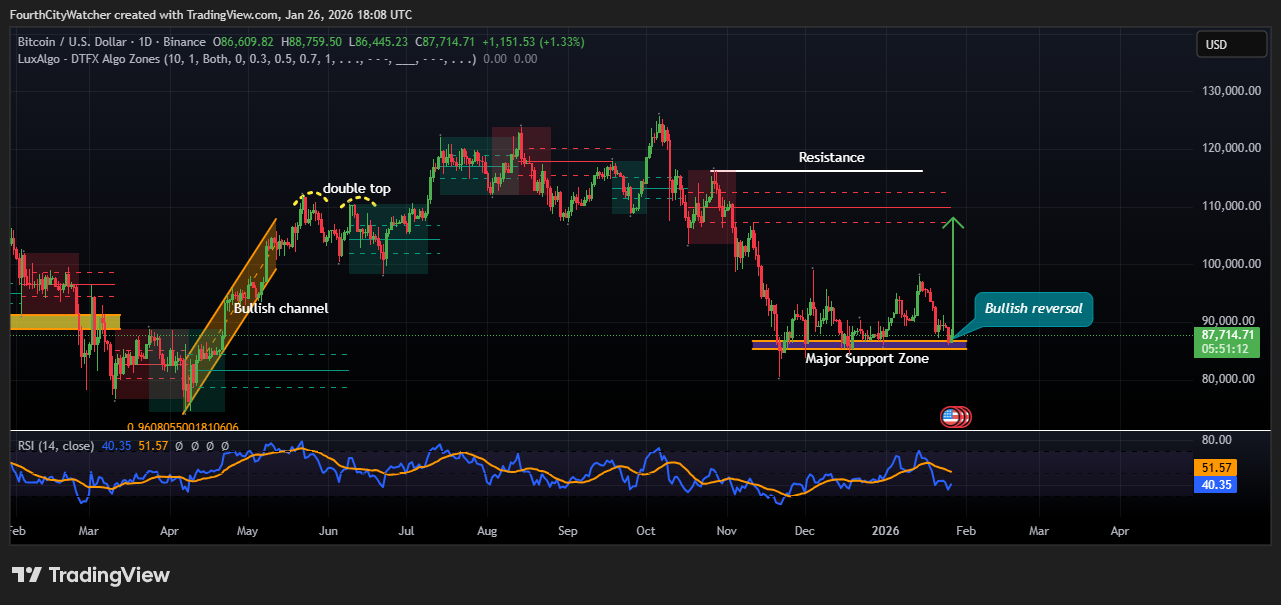
BTCUSD Chart Analysis. Source: Tradingview
Analysts are now watching for a reversal toward resistance levels near $110,000–$112,000. If Bitcoin can sustain buying pressure at the support zone, a move toward these targets may materialize in the coming weeks.
Despite market volatility, Bitcoin continues to attract investor interest amid broader concerns about macroeconomic risks, including potential government shutdowns and inflationary pressures. Traders are closely monitoring price action around support and resistance levels, which have historically influenced BTC’s medium-term trend.
A successful bounce from this critical support level could mark the beginning of a renewed uptrend, reinforcing Bitcoin’s resilience in volatile markets. However, failure to hold this support may open the door to further downside risks.


