Bitcoin Price Dips But On-Chain Data Shows Strength as Holders Keep Accumulating Despite Market Pressure
Bitcoin slipped alongside an 8% drop in Michael Saylor’s Strategy stock, highlighting strong correlation and renewed market uncertainty.

The Bitcoin price has slid by a fraction of a percentage in the last 24 hours, to trade at $114,097.42, on an 11.6% decrease in the daily trading volume, to $65.45 billion.
Bitcoin Price Holds Steady as Long-Term Investors Accumulate
Investors are on edge because Strategy (MSTR), known for huge Bitcoin holdings, saw its stock price crash this week. The crash happened after the company shared bad financial results. More people are worried about the company’s risky debt plan to buy Bitcoin.
In addition, more pressure from U.S. regulators and a fall in tech stocks are making things even more tense for Bitcoin investors.
Even with all this fear, Bitcoin’s on-chain activity stays strong. Bitcoin supply data from Glassnode shows that long-term buyers now hold most coins. Since March, these investors have been adding to their holdings, while fewer coins are being sold at a loss or for profit.
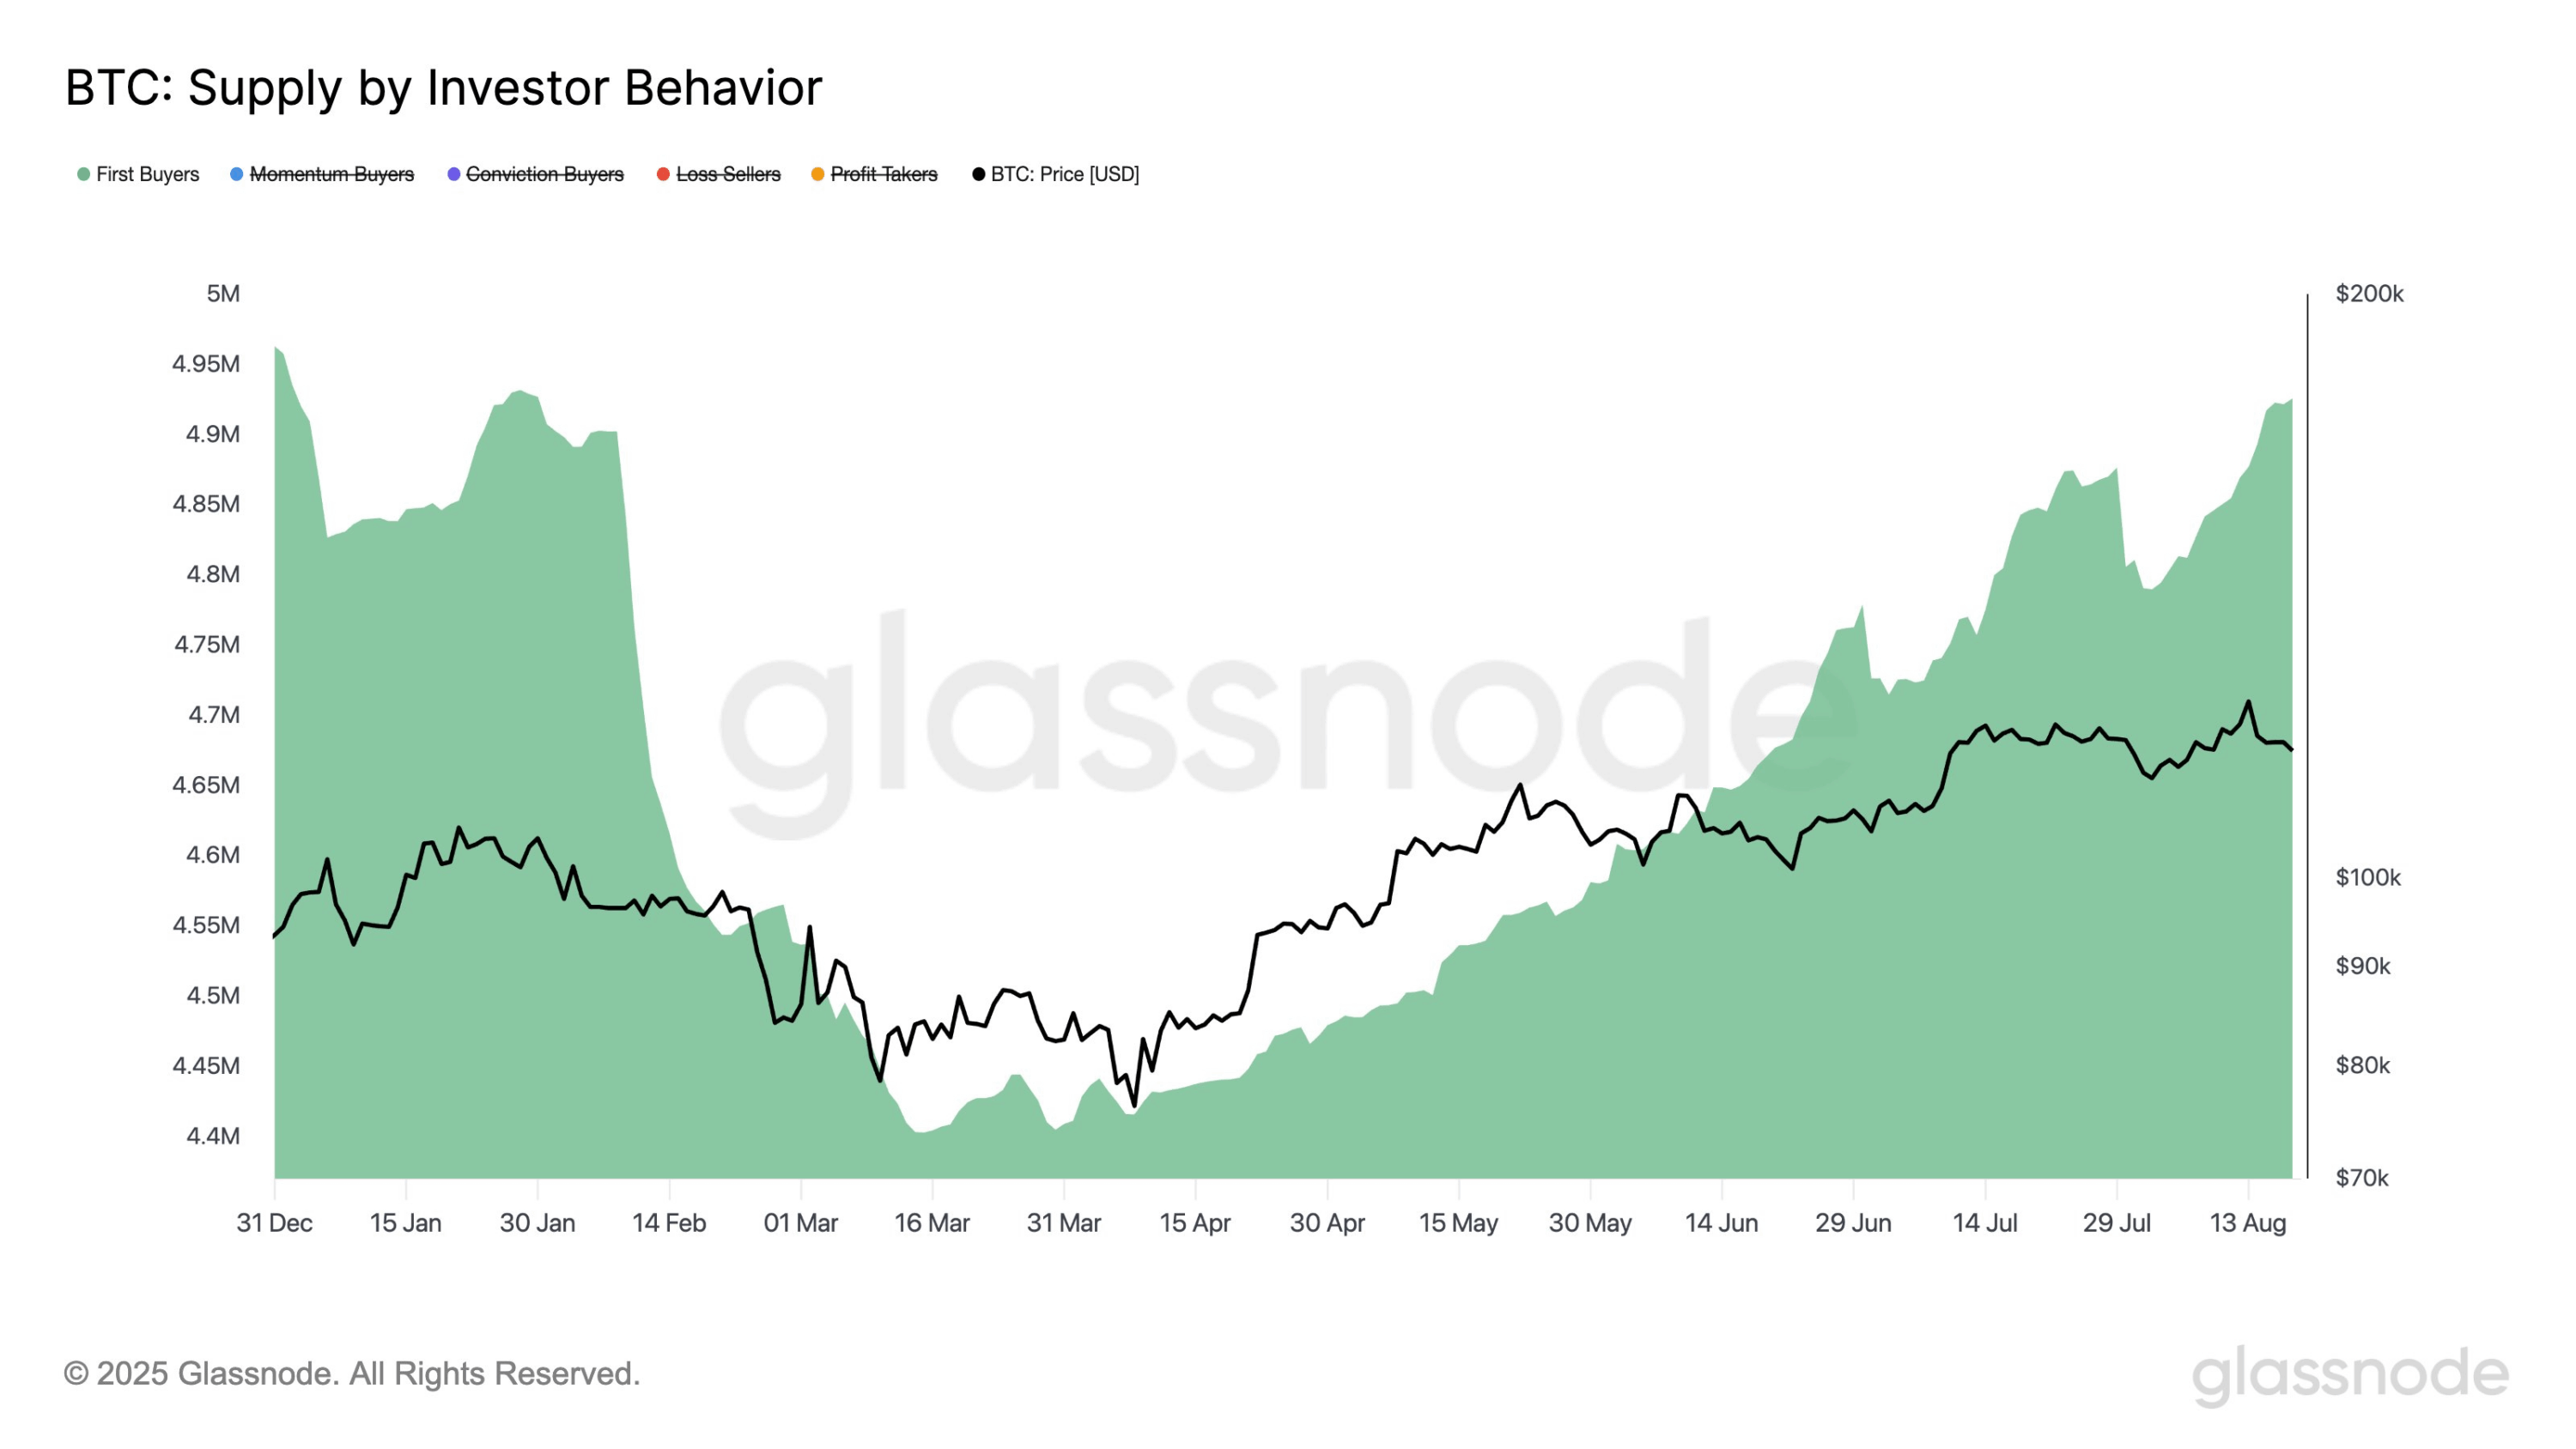
This steady accumulation has supported Bitcoin’s price recovery through June and July, keeping it between $70k and $100k. The trend suggests strong confidence among long-term holders, reducing selling pressure in the market. Analysts believe this tightening supply could prepare Bitcoin for its next big move, depending on overall market sentiment and global economic conditions.
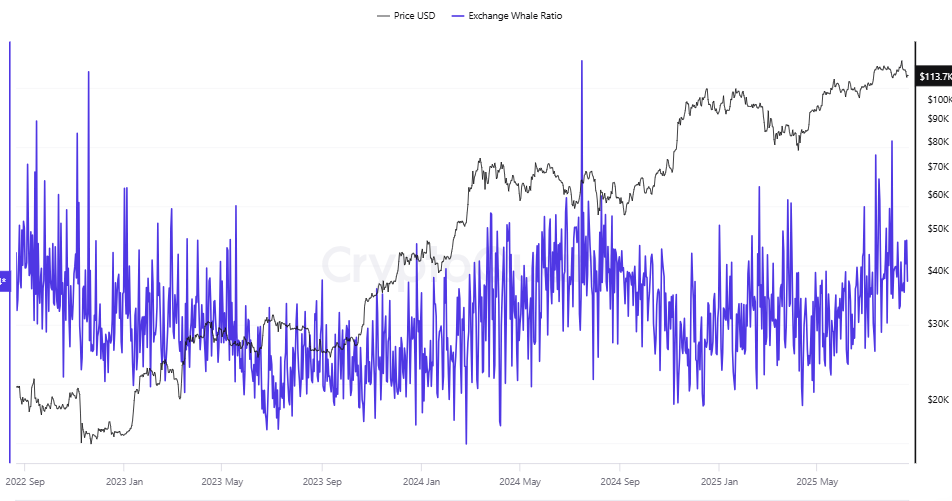
Bitcoin miners are also sending fewer coins to exchanges. This means less new supply is coming onto the market. Large “whale” wallets are holding tight. According to CryptoQuant, exchange inflows and outflows are calm and steady. All these data together show that most big holders are not rushing to sell.
Bitcoin Price Faces Make-or-Break Chart Test
Looking at the chart, Bitcoin is trading above its 200-day simple moving average ($100,553), which is a good sign. It is slightly under the 50-day average ($116,134), which means there is still some resistance above.

BTCUSD Analysis Source: Tradingview
Bitcoin can’t seem to get past $124,500–$125,000, where sellers keep stepping in. The Relative Strength Index (RSI) is at 43.85, showing neutral momentum. The MACD is a bit negative, but not sharply lower. The ADX is below 20, which means trend strength is weak and the price is moving sideways.
Support is strong at $113,000. If Bitcoin falls below this level, it could dip to $100,000 soon. If Bitcoin can bounce and move above $116,000–$118,000, that would bring more buying interest again.
For now, Bitcoin’s coin price is holding steady even as MSTR makes headlines. As long as $113,000 support stands, there is no need for panic. If the market gets more nervous, watch for price swings near key chart levels.


