Bitcoin Price Drops 1.73% as Arthur Hayes Says The Bottom Near

The Bitcoin price slumped 1.73% in the past 24 hours, trading at $84,118, amid a 30% daily trading volume surge to $122.4 billion.
The drop in BTC price happens as BitMEX co-founder Arthur Hayes offered optimism during the downturn, saying the bottom for BTC is near. However, he urged traders to stay patient and wait for a correction in U.S. stocks before making a full commitment. Hayes added that more money spent on printing will eventually fuel new liquidity for Bitcoin, but noted that AI tech stocks must fall first.
He previously linked the BTC crash to shrinking USD liquidity and correctly predicted a drop into the $80,000–$85,000 range. He still expects Bitcoin to reach $200,000 by year-end.
The sell-off accelerated as forced liquidations rippled across trading platforms. Raoul Pal compared the move to past crypto cycles, saying today’s crowded market resembles 2021, when steep losses eventually led to new highs. He highlighted how past bull markets included several large corrections, including a 72% crash in 2019–2020 and multiple 30% pullbacks in 2016–2017.
Macroeconomic expectations also shifted this week. CME FedWatch data now shows a 71% chance of a 25-bps rate cut. Meanwhile, Peter Brandt said Bitcoin could fall to $58,000 before eventually rallying to $200,000 around 2029.
Bitcoin Price Daily Technical Analysis
Bitcoin (BTC) is currently trading at $84,000, showing a decline of 1.33% on the daily chart. The cryptocurrency recently broke below key support levels, indicating strong bearish momentum. A clear bearish channel formed over the last month, signaling sustained selling pressure as the price consistently made lower highs and lower lows. The breakdown from this channel confirms that sellers have taken control of the market.
The chart shows the 50-day simple moving average (SMA) at $106,899 acting as immediate resistance, while the 200-day SMA at $110,232 remains a major long-term resistance level. BTC’s inability to recover above these moving averages reinforces the bearish trend. Price action has retested previous support levels near $90,000 and continued downward, hinting at further downside potential. The next potential support zone is around $74,500, which could provide temporary relief if buyers step in.
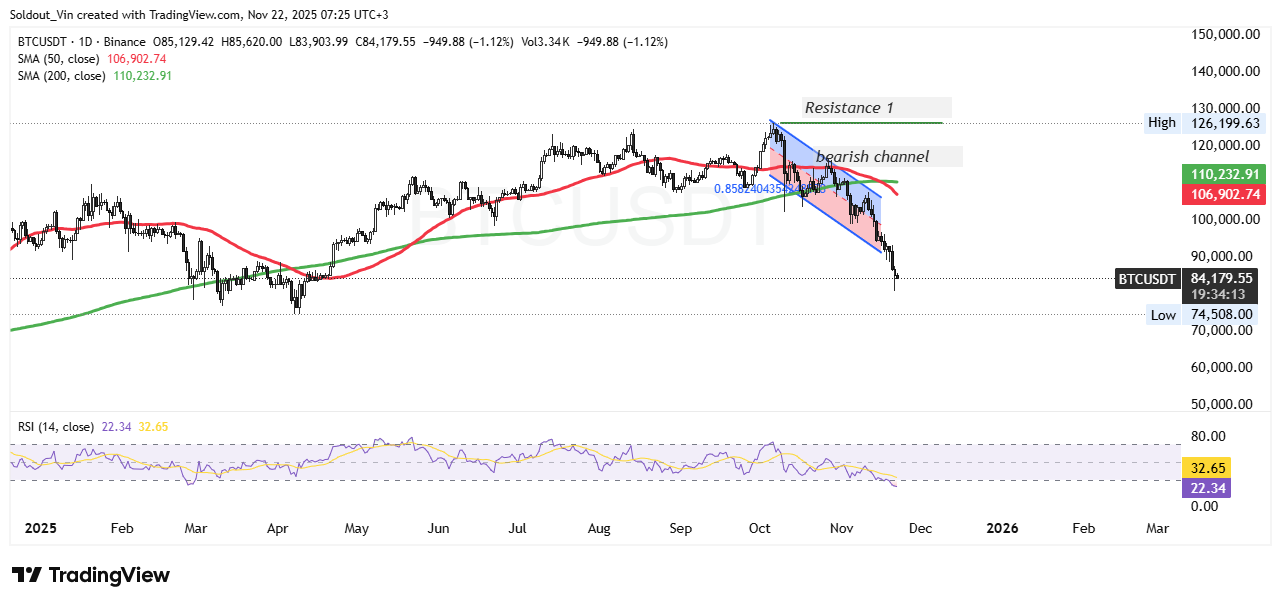
BTCUSDT Daily Chart Analysis Source: Tradingview
Momentum indicators are currently in oversold territory. The Relative Strength Index (RSI) is reading 22.20, signaling that BTC is heavily oversold. Historically, such low RSI levels have often led to short-term bounces, though the overall trend remains bearish. Traders should be cautious, as a rebound from oversold conditions may only be temporary unless accompanied by strong buying volume.
The resistance, near the recent high of $126,199, represents a level that BTC would need to reclaim to shift market sentiment back toward bullish. Until then, the prevailing downtrend is likely to persist. The bearish channel formation, combined with moving averages acting as resistance points, to continued downside risk.


