


Bitcoin Price Drops 2% As Goldman Sachs Says Federal Reserve Rate Cut Next Week ‘Likely’

The Bitcoin price fell 2% in the past 24 hours to trade at $91,450 as of 4:31 a.m. EST on trading volume that dropped 41% to $43.8 billion.
This comes as Goldman Sachs says the Federal Reserve will ”likely” deliver one more 25-basis-point cut next week, before pausing in January to assess data, then ease again in March and June.
That would bring the policy rate down to a range of 3%-3.25% by mid-2026, still well above the pre-pandemic norm, but a meaningful drop from today’s 3.75%-4%.
Goldman Sachs says the labor-market is cooling, with September recording soft payroll numbers. When government hiring and strike distortions are eliminated, private-sector jobs grew by only 39,000.
Rising layoffs, a jump in unemployment among college graduates, and early signs that AI is starting to eat into white-collar roles shows the risk clearly tilting toward a weaker jobs picture.
But the investment bank expects the economy itself to accelerate in 2026, with growth in the 2%–2.5% range, helped by fading tariff fears, possible tax cuts, and easier financial conditions.
White House economic advisor and potential Federal Reserve Chair, Kevin Hasset, also says that the Federal Reserve will likely cut interest rates next week.
According to CME Group FedWatch, the possibility of a Fed rate cut has now surged to 87.2%.
Bitcoin Price Stuck in a Falling Channel – Breakout Or Downward Continuation?
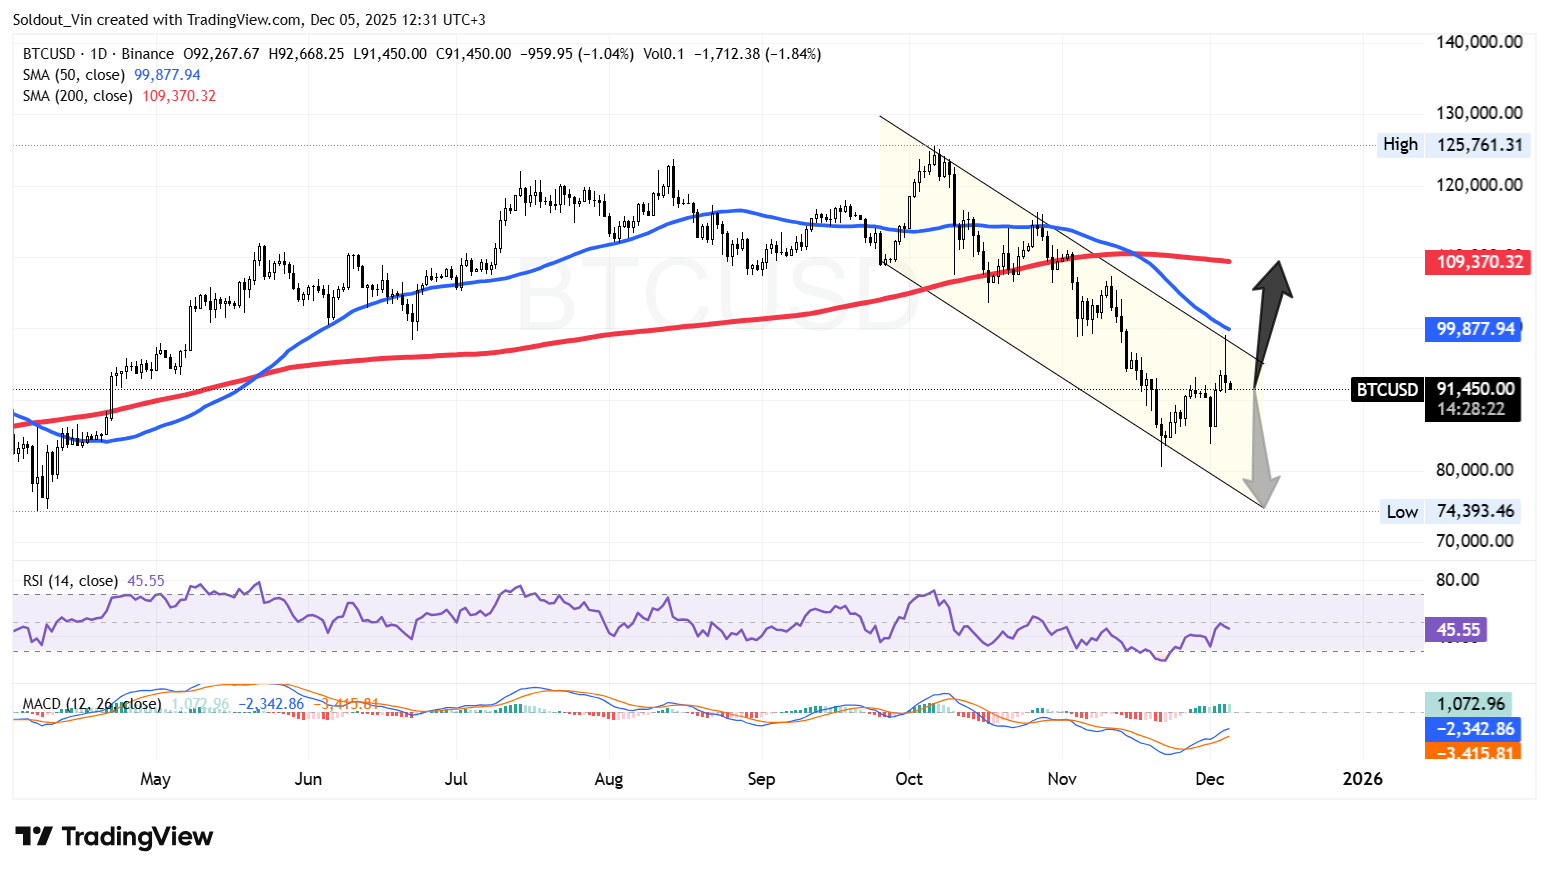
The Bitcoin price is defending the critical $91,800 zone. A clean hold here opens a fast move to $100,000 fueled by short squeezes and resting liquidity above the current price. Even a brief washout to $88–89K would keep the higher-timeframe uptrend intact.
The daily chart shows Bitcoin has broken out of a months-long rising trend. For the past several months, the price of BTC was supported by a clear upward-sloping red trendline (200-day Simple Moving Average (SMA) that acted as a floor.
Today, Bitcoin price still trades well below that line, a move many traders see as a warning sign.
It also sliced through two key moving averages: The 50-day SMA (blue line) at $99,877, and the 200-day SMA (red line) at $109,370. Losing both of these important levels in quick succession has shaken confidence.
BTC Price Prediction
The chart shows a large black downward arrow pointing toward $76,000–$80,000, which lines up with previous support levels from earlier in 2025. If buying doesn’t return soon, many analysts think Bitcoin could fall to that zone next.
The RSI is currently at 45 and moving higher, signaling that bullish momentum is rising. Meanwhile, the MACD has flashed a bullish crossover and has been trending upward.
In simple terms, Bitcoin was in a steady uptrend for months, but the trend has now broken. The price is dropping fast, and the next major support is much lower, around $76,000–$80,000.
Conversely, if the bulls take charge and break the upper boundary of the falling channel, the next key resistance lies at the $109,370 level (200-day SMA).
About Author

About Author




