Bitcoin Price Holds Weak at $94K as Peter Schiff Renews Attack on Strategy

The Bitcoin price slumped 1.52% in the past 24 hours, trading at $94,118, amid an 8% daily trading volume surge to $42.4 billion.
This comes as Gold supporter Peter Schiff has renewed his criticism of Bitcoin and MicroStrategy, calling the company’s business model a “fraud.” He also challenged MicroStrategy founder Michael Saylor to a debate during Binance Blockchain Week in Dubai this December. Schiff claims that MicroStrategy depends on funds buying its “high-yield” preferred shares, but says these yields will never actually be paid. He warns that once investors realize this, they will sell the shares, stopping the company from raising more debt and pushing it into a “death spiral.”
His comments come as Bitcoin continues to fall, dropping below $99,000 and losing more than 20% from its record high above $125,000 in October. The crypto-treasury sector has also weakened, while gold has climbed back above the key $4,000 level.
MicroStrategy’s mNAV—its price premium over the value of its Bitcoin holdings—fell below 1 in November and has only recovered slightly to 1.21, still far below the preferred level of 2. The company’s stock price has dropped more than 50% since July and now trades near $199.
Bitcoin Price Struggles Below Key Moving Averages as Bearish Channel Dominates
Bitcoin is trading around $94,910 after a small 0.69% gain in the past 24 hours. Even though the price has recovered slightly, the overall trend on the daily chart still looks weak. Bitcoin continues to move within a bearish channel, indicating that the market is forming lower highs and lower lows. This signals that sellers are still in control.
Right now, Bitcoin is trading below two important moving averages. The 50-day SMA is around $109,941, and the 200-day SMA is around $110,437. These two levels have become strong resistance areas. For Bitcoin to turn bullish again, the price must break above both moving averages and close above them. If that doesn’t happen, the bearish trend will likely continue.
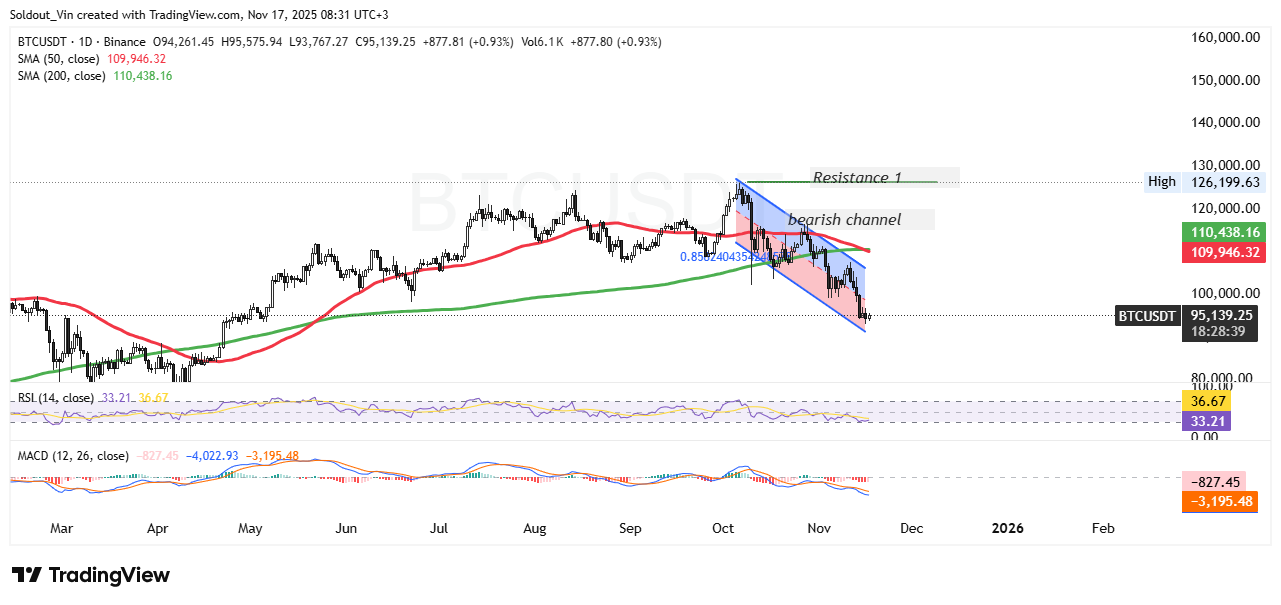
BTCUSDT Analysis Source: Tradingview
The bearish channel remains the key pattern to watch. Bitcoin has failed several times to break above the upper trendline of the channel. Each attempt has been rejected. The price is now near the lower trendline again, which is acting as support. If Bitcoin breaks below this support level, the price could drop further toward the psychological $90,000 mark.
The indicators also show weakness. The RSI is at 32.66, close to the oversold zone. This means the market is under selling pressure, but it also shows the price may be near a short-term bounce area. Still, a clear recovery signal would only come if the RSI moves above the 40–50 range.
The MACD remains deep in negative territory. The histogram continues to print red bars, which shows that downward momentum is still strong. This confirms that the bears still have the upper hand.
For now, Bitcoin needs a strong push to break out of the bearish channel. A move above $110,000 would be the first sign of a bullish reversal. If that happens, the next major resistance sits near $126,000, which is the recent local high.


