Bitcoin Price Jumps As Robert Kiyosaki Says Short-Term BTC and Gold Fluctuations Don’t Matter

The Bitcoin price is currently trading at $90,283, up 1% after a brief rally that pushed it above $95,000 last week, showing signs of a market correction.
That price surge comes as gold demonstrates strong momentum, rising to $4,915 following a four-day surge and reaching an all-time high of $4,967. These movements highlight the varying trends in traditional and digital assets, reflecting shifts in investor sentiment and market dynamics.
Despite these fluctuations, financial educator and investor Robert Kiyosaki remains unfazed. In a recent tweet, he emphasized that he does not focus on the daily price swings of gold, silver, Bitcoin, or Ethereum. He attributes short-term price changes to broader economic trends, such as the increasing U.S. national debt and the declining purchasing power of the dollar.
Kiyosaki believes that these factors make daily fluctuations relatively insignificant for long-term investors. At the same time, he criticized the Federal Reserve and the U.S. Treasury, labeling their leadership as highly educated yet ineffective in managing the economy.
Despite these criticisms, Kiyosaki continues to recommend investing in gold, silver, Bitcoin, and Ethereum as a hedge against instability in conventional financial systems. The crypto market, however, is showing signs of stress. The total market capitalization is at risk of dropping below $3 trillion, while the Crypto Fear & Greed Index has fallen to extreme fear at 24, down from a neutral 49 last week.
U.S. spot Bitcoin ETFs also recorded their largest weekly outflows since November, totaling $1.22 billion. External factors such as tariffs, though recently abandoned in some cases, continue to add pressure on crypto markets.
Bitcoin Price Hints at a Possible Bounce
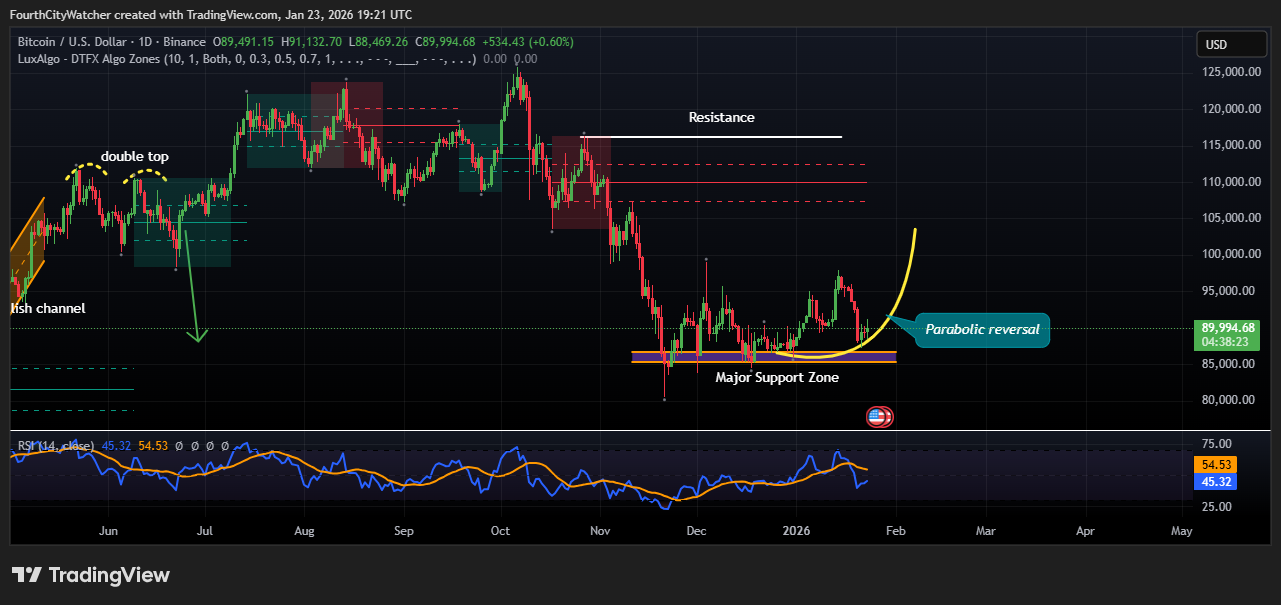
Bitcoin price signals a potential trend reversal after successfully defending a major support zone. The BTC/USD pair is currently trading around $90,400, posting a modest daily gain as buyers step in near a well-defined demand area between roughly $85,000 and $88,000.
This zone has acted as a strong floor since December, repeatedly absorbing sell pressure after the sharp correction from the $120,000 region. The chart highlights that the recent sell-off has slowed significantly, with price action compressing and beginning to curve upward, a structure often associated with early-stage parabolic reversals.
Bitcoin Weak Selling Pressure Signals Potential Move Toward $100K
Bitcoin previously faced heavy resistance near the $112,000–$115,000 range, where multiple failed breakout attempts formed a broader topping structure. That rejection triggered a steep decline into the current support area. However, unlike prior pullbacks, bears have been unable to push the price decisively lower, suggesting selling momentum is weakening.
The yellow projected curve on the chart points to a possible acceleration higher if buyers maintain control, especially if BTC can establish higher lows above the support band.
Momentum indicators add weight to this cautiously bullish outlook. The Relative Strength Index (RSI) on the daily timeframe is hovering in the mid-40s to low-50s range, recovering from oversold conditions seen during the December lows.
While RSI has not yet entered strong bullish territory, the gradual uptick indicates improving momentum rather than exhaustion. Analysts note that a sustained move above the psychological $95,000 level would likely confirm a short-term trend shift and open the door for a retest of $100,000.