Bitcoin Price Rises 3% as IBIT ETF Inflows Top $25B in 2025

The Bitcoin price has surged 3% in the past 24 hours to trade at $87,864 on a 12% drop in the daily trading volume to $46 billion
The surge in BTC price happens as investors continue to pour money into BlackRock’s Bitcoin ETF (IBIT) despite a challenging year for Bitcoin in 2025. IBIT attracted more than $25 billion in net inflows, ranking sixth among all ETFs by annual flows, according to Bloomberg ETF analyst Eric Balchunas.
This is notable because IBIT was the only ETF in the top rankings that posted a negative return for the year. The strong inflows suggest a shift in investor mindset. Rather than focusing on short-term price performance, many investors are now treating Bitcoin exposure as a long-term allocation.
Balchunas argues that sustained inflows matter more than temporary price weakness, a view supported by continued Bitcoin accumulation from large players such as Michael Saylor’s Strategy.
IBIT also outperformed gold-backed ETFs like GLD in capital raised, even though gold posted gains of over 60% this year. This contrast highlights changing investor behavior. Bitcoin ETFs are increasingly seen as long-term holdings rather than speculative trades.
BlackRock’s strong brand and distribution network have lowered barriers for traditional investors entering crypto markets. Meanwhile, on-chain data shows “new whales” now control nearly half of Bitcoin’s realized capital, adding structural support to BTC prices.
Bitcoin Price Slips Below Key Support as Rounded Top Signals Weak Momentum
Bitcoin (BTC/USDT) on the daily chart shows a clear rounded top pattern, which usually signals a shift from an uptrend to a downtrend. After months of rising prices, Bitcoin failed to hold above the $120,000–$125,000 resistance zone, where sellers stepped in and stopped the rally.
As the price moved lower, BTC broke below the neckline support near $90,000, confirming that bearish pressure is now stronger than buying demand. Currently, Bitcoin is trading at $87,800, slightly below the neckline.
This area is important. If BTC stays below $90,000, the bearish structure remains intact. However, the curved yellow trendline suggests price is nearing a possible slowdown zone, where selling pressure may begin to weaken.
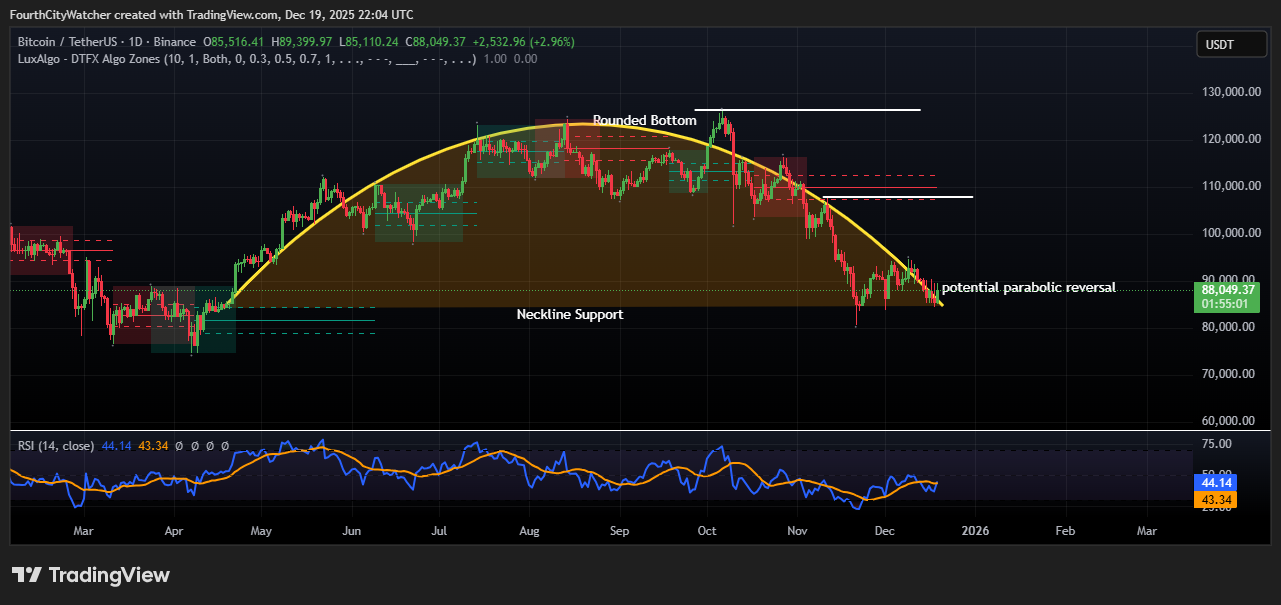
BTCUSDT Analysis Source By Tradingview
The chart also highlights a potential parabolic reversal area, indicating that BTC could experience a short-term bounce if buyers step in. This would likely be a relief rally rather than a full trend reversal unless price breaks back above key resistance levels.
The RSI (14) is around 43, which shows weak momentum but not oversold conditions. This suggests sellers are losing some strength, yet buyers have not fully taken control. For a stronger recovery, the RSI would need to move back above the 50 level.
On the upside, Bitcoin faces resistance between $95,000 and $102,000. A daily close above this zone would improve the outlook and reduce bearish risk. Until that happens, any upward moves may be temporary.


