Bitcoin Price Slides 3% as Market Doubts Grow Despite Fed’s $40B Stimulus Push

The Bitcoin price has slipped 3% in the past 24 hours to trade at $90,413 on a trading volume surging 7% to $70 billion.
The slump in BTC price comes as derivatives traders grow increasingly doubtful that Bitcoin can sustain any meaningful upside, even with the Federal Reserve shifting toward a more expansionist monetary policy. The Fed kept rates capped at 3.75% and announced a $40 billion program to buy short-dated government bonds, reversing years of balance-sheet reduction.
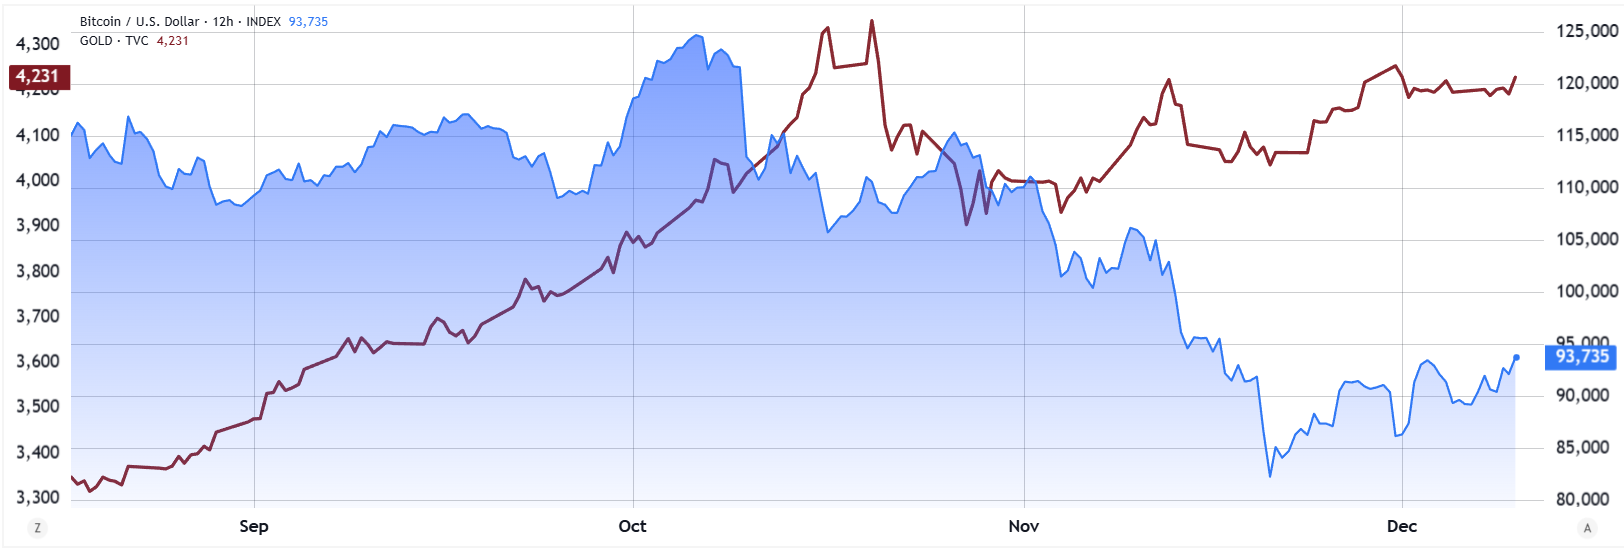
While this added liquidity typically boosts credit growth and supports risk assets, Bitcoin continues to lag behind gold and equities. Options markets reflect this skepticism: the $100,000 January 30 BTC call now implies a 70% chance that Bitcoin stays below that level, with its premium falling from $12,700 a month ago to $3,440.
The January expiry also falls two days after the next FOMC meeting, adding to uncertainty amid limited visibility into US economic data. Meanwhile, the S&P 500 has gained 13% as falling Treasury yields increase equity appeal, while Bitcoin sees less predictable inflows. With whales and market makers remaining cautious, a clear catalyst for a sustained BTC rally has yet to emerge.
Bitcoin Price Rebounds From Major Support Zone
Bitcoin is trying to recover after a strong drop that pushed the price into the major support zone between $75,000 and $82,000. This area has acted as a strong buy zone many times before, and the latest bounce shows that buyers are still active here. Price also touched the long-term upward trendline (green), which helped stop the sell-off.
BTC recently broke out of a bearish channel, but the recovery is still slow. Right now, the price is sitting just above the lower Bollinger Band, which shows the market was oversold. The next important level is the middle Bollinger Band at $94,487. If Bitcoin moves above this level, it will show that bullish momentum is improving.
The 200-day SMA at $88,843 is holding as support. As long as BTC stays above this moving average, the long-term trend remains bullish. The 50-day SMA at $109,154 is the next major resistance and will likely be a challenge for buyers.
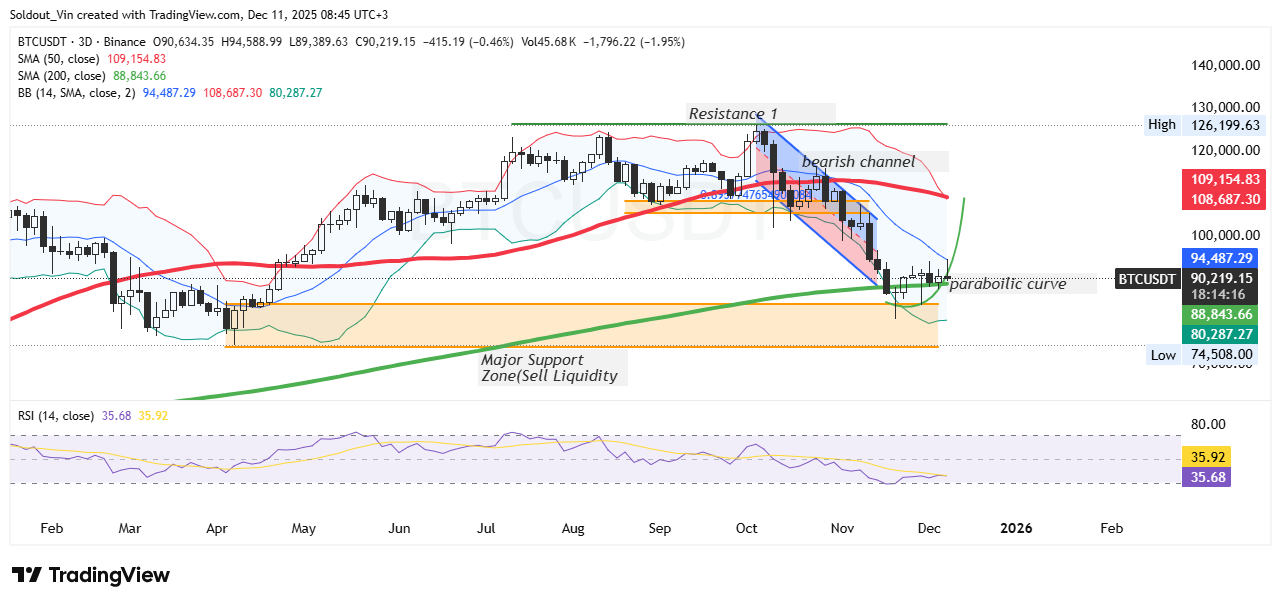
The chart also shows a possible parabolic curve forming, suggesting Bitcoin might be starting a slow recovery from this bottom area. But for this pattern to become valid, BTC must break above $100,000. If that happens, the next target zone is between $120,000 and $126,000, where the last major rejection happened.
The RSI is at 35.68, which is close to oversold. This usually signals that selling pressure is getting weaker. While there is no clear bullish divergence yet, this RSI level often appears near local bottoms.
In the short term, Bitcoin must stay above $88,000 to keep the recovery valid. A drop below $80,000 would put the price back into the liquidity zone, increasing the risk of falling toward $74,500. On the upside, if BTC moves above $95,000, it could push toward the 50-day SMA and the upper Bollinger Band around $108,000.


