


Bitcoin Price Slips Below $88K As Tom Lee Predicts “Monster Move” In 3 Months

The Bitcoin price edged down over 1% in the past 24 hours to trade at $87,381 as of 1:23 a.m. EST on trading volume that surged 7% to $36 billion.
BTC slipped below the $88,000 level, which comes as Fundstrat’s Tom Lee suggests that the Bitcoin price will make a “monster move” in 3 months, potentially driven by factors like Fed rate cuts and supply/demand dynamics.
In an interview with CNBC, Lee says that Bitcoin might reach $200,000 in 2026, amid discussion of a crypto Supercycle.
Bitcoin’s path to $200,000 would build on its all-time high, potentially fueled by ETF (exchange-traded funds) inflows and halving cycles. Meanwhile, on-chain metrics, including increasing BTC accumulation addresses, support the bullish case.
However, BTC has dropped over 3% in the last two weeks, a trend visible in the spot BTC ETFs.
This comes as data from Coinglass shows that spot BTC ETFs have recorded 6 days of consecutive outflows.
Is BTC set for the move predicted by Tom Lee?
Bitcoin Price Consolidates As Bulls Attempt Recovery
The BTC price has remained under pressure after rejecting from the upper resistance region near $94,000, an area that has repeatedly capped upside attempts throughout December.
This rejection followed an earlier decline from the mid-$90,000s, placing the Bitcoin price into a broader corrective phase on the 4-hour timeframe.
Following the sell-off, BTC found support around the $84,000 zone, which aligns closely with the 0.618 Fibonacci retracement level. This region has acted as a key demand area, allowing the price to stabilize and trade sideways within a defined range.
Currently, Bitcoin is consolidating between $84,000 support and $90,000 resistance, with price action compressing as volatility continues to decline.
The bearish structure remains intact as the price of Bitcoin continues to trade below both the 50-day and 200-day Simple Moving Averages (SMAs) on the 4-hour chart.
Meanwhile, the Relative Strength Index (RSI) is currently hovering around 46–47, remaining below the neutral 50 level. This indicates that momentum is neither overbought nor oversold, consistent with the ongoing consolidation phase.
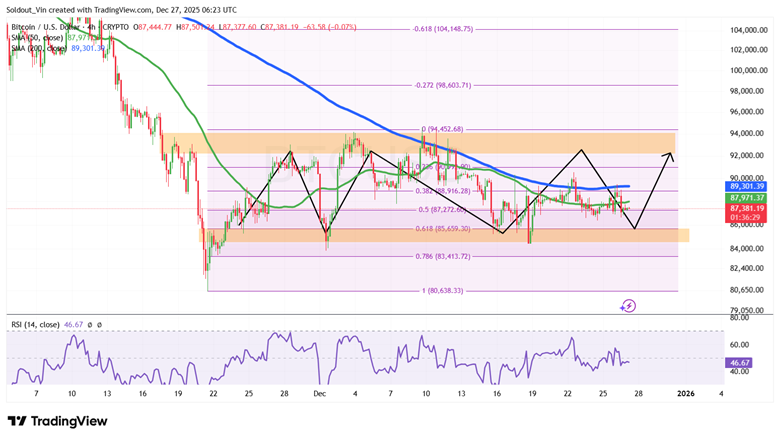
BTC/USD Chart Analysis: TradingView
BTC Price Prediction
Based on the BTC/USD 4-hour chart analysis, the BTC price is forming a range-bound structure within a broader downtrend. The series of higher lows against lower highs points toward a compression phase, often preceding a larger move.
If BTC breaks and holds above the 200-day SMA and the $89,000–$90,000 resistance zone, the next upside target lies near $92,000, followed by the major supply region around $93,500–$94,000.
Conversely, if sellers regain control and push the price of BTC below the $86,000 support, Bitcoin could revisit the 0.786 Fibonacci level near $83,400, with deeper downside risk toward the low-$80,000s if momentum accelerates.
About Author

About Author




