Bitcoin Price Stabilizes Above $95K as CryptoQuant CEO Signals Strong Market Support

The Bitcoin price surged 0.52% in the past 24 hours, trading at $95,218, amid a 12% daily trading volume surge to $52.4 billion.
Bitcoin has dropped into the mid-$90,000s, but CryptoQuant CEO Ki Young Ju says the market is still stronger than many traders think. He believes Bitcoin can bounce back anytime as long as new money keeps flowing in. Even after the price fell from $114,000 last week—mainly because of a stronger dollar and rising interest rates—buyers are still accumulating.
Ju points to Bitcoin’s realized cap, which has reached a record $1.12 trillion. This shows that investors are continuing to buy at higher prices. Recent big purchases, like Strive’s $162 million buy, support this trend.
He also highlights a key support area around $94,000. Wallets holding Bitcoin for 6–12 months have an average cost near this level, making it an important price floor. Ju says Bitcoin would need to fall clearly below $94,000 to confirm a true bear market. Meanwhile, whale selling has slowed down, which often signals the start of price stability.
Still, macro factors like a strong dollar and rising yields are pressuring Bitcoin. Prediction markets show traders see a 63% chance that Bitcoin could fall below $90,000 before the year ends.
Bitcoin Holds Above $95K but Still Stuck in a Bearish Trend
Bitcoin is trading around $95,695 after a mild rebound, but the overall market structure remains bearish. On the daily chart, the price remains within a descending bearish channel, indicating that sellers continue to dominate. Bitcoin also remains firmly below the 50-day SMA at $110,315 and the 200-day SMA at $110,452, confirming that the broader trend is still downward. For bulls to regain control, the price must break above this channel and reclaim these two major moving averages.
The upper boundary of the bearish channel is the first key resistance to watch. If Bitcoin manages to break above this zone, it could climb toward the $110K region, where both the 50-day and 200-day SMAs create a strong resistance cluster. Above that, the next major resistance sits near $126,199, marked as Resistance 1 on the chart. This level represents the previous major swing high and will be a crucial point for any bullish continuation.
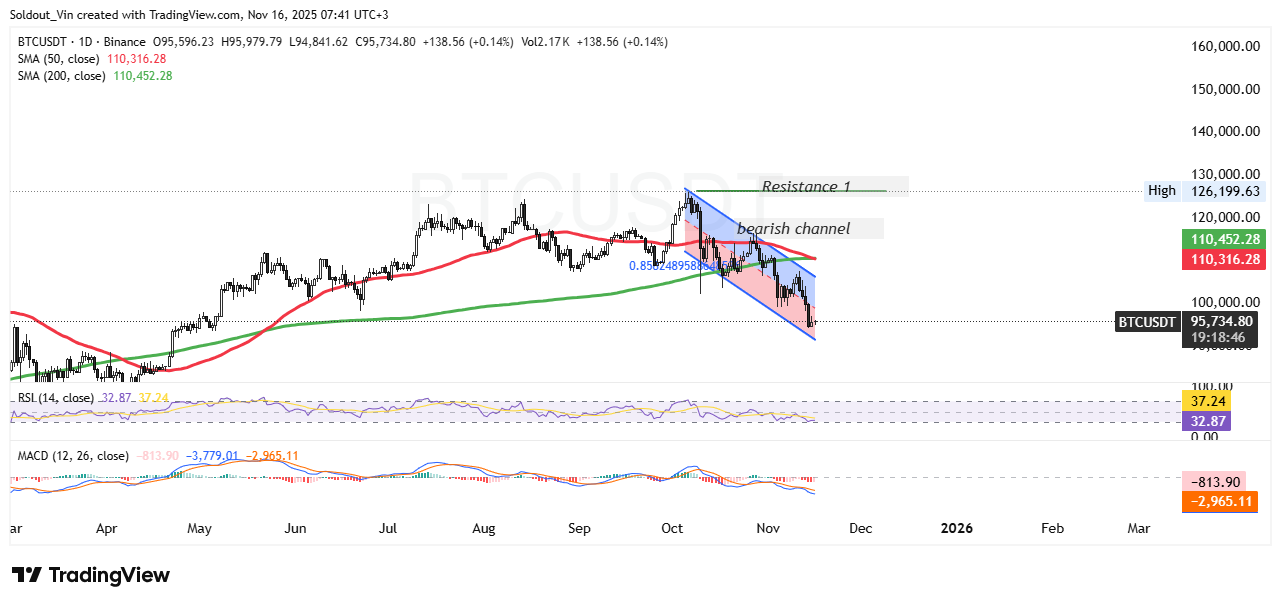
BTCUSDT Analysis Source: Tradingview
Momentum indicators continue to signal weakness. The RSI (14) is currently around 32, close to the oversold zone, suggesting that selling pressure may be losing strength, but a strong trend reversal has not yet formed. The MACD also remains negative, indicating that downward momentum continues to dominate. Unless these indicators show improvement, a bullish breakout may be limited.
If Bitcoin fails to hold above the $95K support area, the next likely drop could push the price toward the $90K zone, which previously acted as a strong demand area. On the other hand, a decisive move above the bearish channel, followed by a reclaim of $100K, would be the first sign of strength from buyers.
For now, Bitcoin needs a breakout above both the channel and the $110K zone to confirm a full trend reversal and signal the start of a new upward move.


