Bitcoin Price Surges 2% as The Crypto Market Recovers from a $19B Crash Despite ETF Outflows

The Bitcoin price surged 2% in the past 24 hours, trading at $111,218, amid a 12% daily trading volume surge to $62.4 billion.
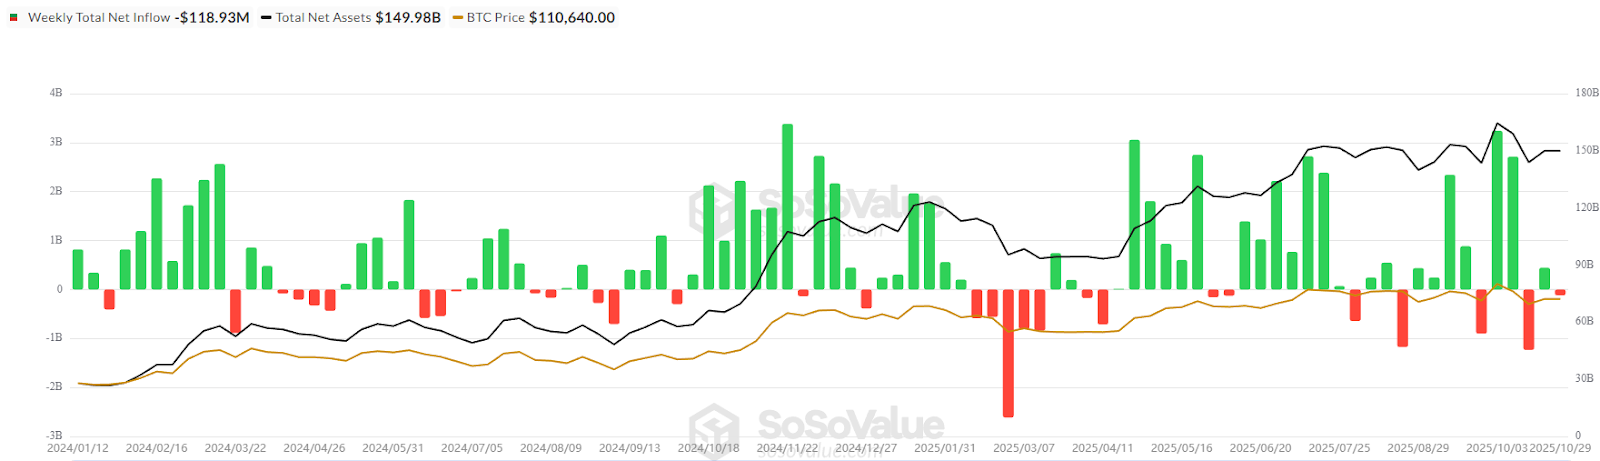
This surge in BTC price comes as the crypto market starts to recover from a $19 billion crash earlier in the month. Investors regained confidence after signs of progress in U.S.–China trade relations, with hopes that the tariff dispute could soon end. However, the optimism faded midweek when Bitcoin ETFs recorded $470 million in outflows, even after the U.S. Federal Reserve cut interest rates by 0.25%.
The situation worsened when the trade talks between President Donald Trump and President Xi Jinping ended without any major results, creating fresh uncertainty in global and digital asset markets.
Despite the shaky sentiment, Strategy co-founder Michael Saylor remains confident that Bitcoin could reach $150,000 by the end of 2025. He believes stronger U.S. support for crypto—through tokenized securities, stablecoins, and better regulations—will fuel the next bull run. Standard Chartered Bank also expects massive growth in blockchain-based finance, predicting that tokenized real-world assets could hit $2 trillion by 2028 as more institutions join DeFi.
Still, not all developments were positive. K33 Research warned that new altcoin ETFs may struggle without BlackRock’s involvement, as the firm’s iShares Bitcoin Trust has driven nearly all ETF inflows this year. Meanwhile, Solana’s first staking ETF could bring in $3–$6 billion in its first year, offering holders a 5% passive income.
On the DeFi side, dYdX proposed a $462,000 compensation plan for traders affected by its recent outage. By week’s end, most cryptocurrencies traded lower, with Plasma (XPL) and DoubleZero (2Z) posting the steepest declines.
Bitcoin Shows Double Bottom, Eyes Bullish Reversal
Bitcoin (BTC) shows a possible bullish reversal after forming a double bottom pattern near the $102,000–$104,000 support zone. The price has now moved up to around $109,673, gaining 1.25% in the last 24 hours. This pattern often signals the end of a downtrend and the start of a new upward move.
The chart shows BTC trading sideways for several months in a consolidation phase between $100,000 and $120,000. The double bottom formation and price bounce from support suggest buyers are stepping back in. If Bitcoin breaks above the neckline resistance at $112,000, it could confirm a bullish reversal. The next potential target after a breakout is around $145,000–$150,000, where traders may take profits.
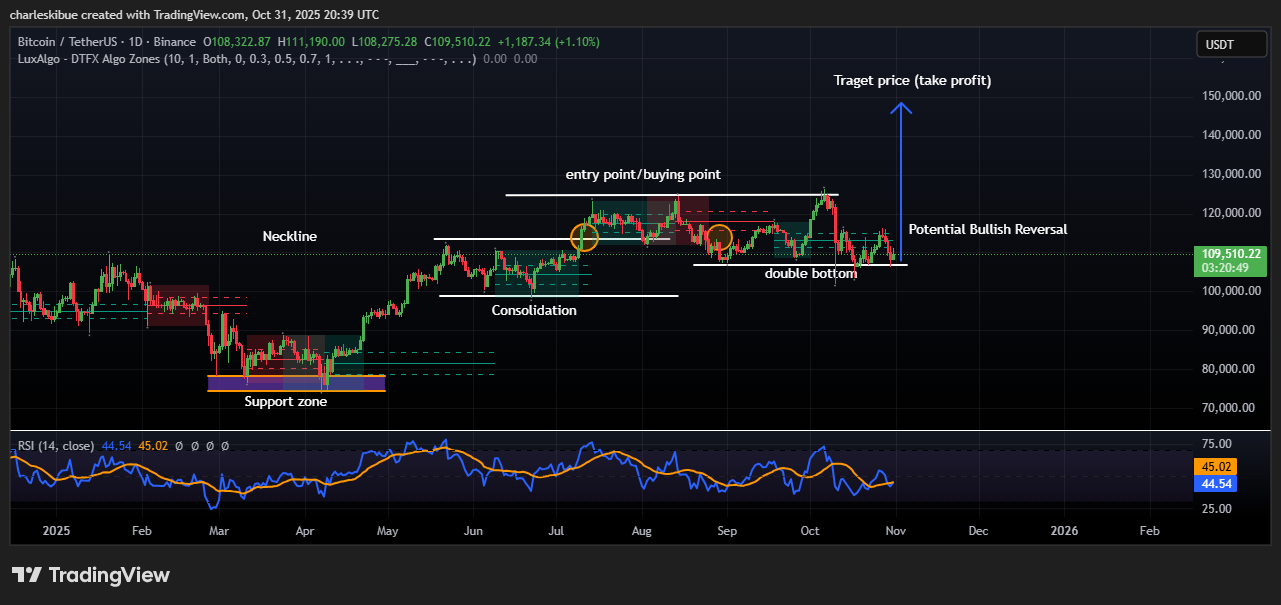
BTCUSDT Analysis Source: Tradingview
The RSI indicator is currently around 45, showing neutral momentum but pointing slightly upward. This suggests selling pressure is easing, and Bitcoin could gain strength if buyers push above key resistance. For traders, the entry zone or buying point remains just above the neckline near $112,000.
A confirmed breakout above this level with strong volume would signal the start of a new uptrend. However, if BTC fails to break out, it may continue to move sideways or retest the $102,000 support zone again.
In short, Bitcoin is building a strong base after weeks of consolidation. The double bottom pattern is a positive sign that could lead to a rally if resistance breaks. Traders are watching closely; a move above $112,000 could open the way toward $145,000–$150,000, marking a strong recovery phase for BTC.