Bitcoin Price Surges 8% as Kevin O’Leary Dismisses Fed Rate-Cut Speculation
The Bitcoin price has surged 8% in the last 24 hours to trade at $92,743 on a 4% daily trading volume drop to $80.8 billion.
That BTC price jump comes even as American entrepreneur Kevin O’Leary pushes back against growing speculation that the U.S. Federal Reserve will cut interest rates in December, a move normally seen as bullish for crypto. Despite markets assigning an 89.2% chance of a cut, O’Leary says he doesn’t expect the Fed to ease policy, citing persistent inflation and rising input costs.
Still, he insists the Fed’s decision won’t have a major impact on Bitcoin’s price. O’Leary believes BTC has settled into a stable range and is likely to move only within 5% of current levels, with no strong upside catalysts in sight. Bitcoin has already dropped 17% over the past month and is trading around $91,440.
Rate-cut expectations have swung sharply in recent weeks, briefly falling to 33% before surging again after dovish comments from New York Fed President John Williams. Markets had expected continued easing after cuts in September and November.
Bitcoin Price Bulls Regain Control After Recent Dip
Bitcoin is attempting a recovery after weeks of sustained downside pressure, with the price now trading at $92,700. The chart shows that BTC recently broke out of a bearish channel, marked by a sequence of lower highs and lower lows that dominated the market through October and November.
This decline pushed Bitcoin into the strong demand zone between $86,000 and $90,000, an area that has historically attracted buyers and sparked rebounds. The current reaction from this zone suggests buyers are gradually regaining control. Price has formed higher lows over the last few sessions, while the market is beginning to trace a parabolic curve, signaling a potential shift from a corrective structure to early bullish momentum.
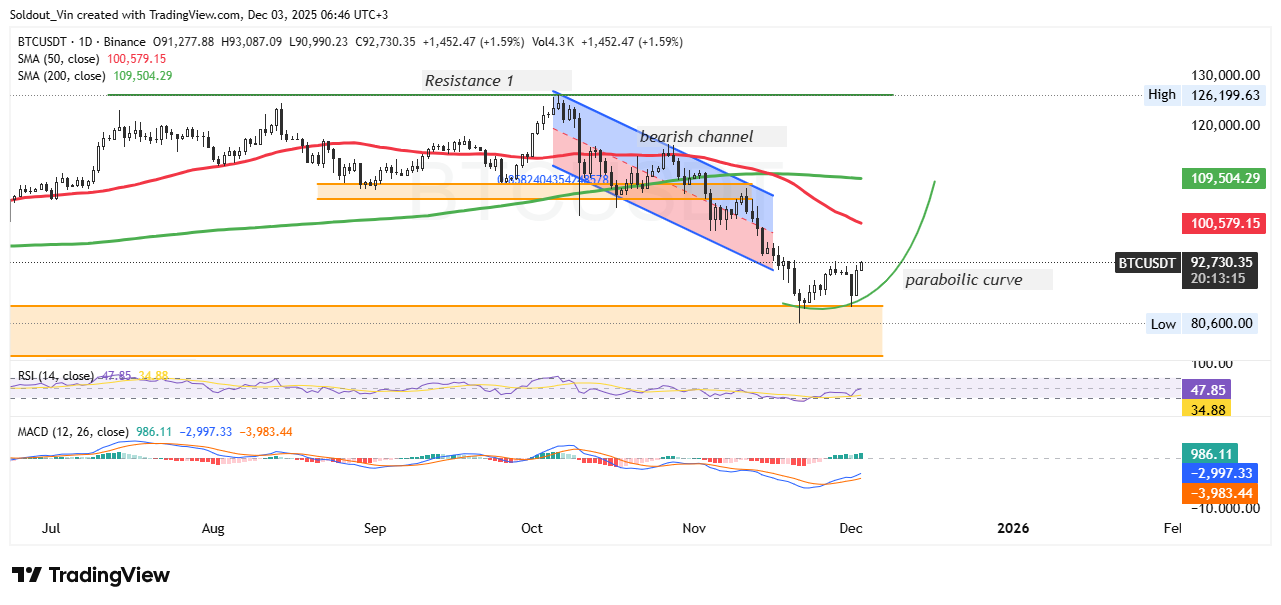
BTCUSDT Chart Analysis. Source: Tradingview
A successful continuation along this curve could open the door for a retest of the 50-day SMA at $100,579, which now acts as the first major resistance.
Bitcoin Indicators Signal Potential Mid-Term Rebound
The 200-day SMA at $109,504 is a key long-term level. Regaining this area would strengthen the bullish outlook and confirm that the broader uptrend is resuming. Beyond these moving averages, the next major barrier is Resistance 1, a horizontal level close to $126,000, which capped previous rallies.
The RSI, currently around 47, has bounced from oversold conditions and is trending upward, indicating that bearish strength is easing. A move above the 50 midpoint would signal stronger bullish momentum. The MACD is also showing signs of potential reversal; although still below the signal line, the histogram is contracting, suggesting that selling pressure is weakening and a bullish cross may form soon.
If Bitcoin fails to maintain support above the $86,000–$90,000 range, the recovery setup may invalidate, leaving room for deeper retracement toward the lower support at $80,600. However, as long as BTC continues to respect the forming parabolic curve and builds structure above recent lows, the probability of a mid-term rebound remains favorable.


