


Bitcoin Stuck At $90K As Peter Schiff Warns Decline Could Deepen Into December

The Bitcoin price edged up a fraction of a percentage in the past 24 hours to trade at $90,971 as of 11:14 a.m. EST, with trading volume dropping 35% to $38.9 billion.
This comes as the indefatigable BTC critic, Peter Schiff, has doubled down on his bearish thesis, warning that Bitcoin could continue its divergence in December and in 2026.
“With all the hype and buying from $MSTR and other Bitcoin treasury companies in 2025, with just one month left in the year, Bitcoin is down 4%. Yet without any hype or corporate buying, gold and silver are up 60% and 95%. This divergence will likely continue in December and in 2026,” Schiff said in an X post.
Schiff argues that Bitcoin’s recent price correction, which saw BTC drop to $80,500 from a peak of above $126,000, validates his theory that the asset is structurally incapable of maintaining long-term value, as compared to Gold and Silver.
In another post, Schiff reminds investors that, if they followed his advice in February and sold BTC to buy silver, they would now have about 70% more purchasing power.
With the price of BTC now down 16.5% in the last month, can the bears support the Schiff narrative to push BTC further down?
Bitcoin Price Poised For A Bullish Trend Reversal
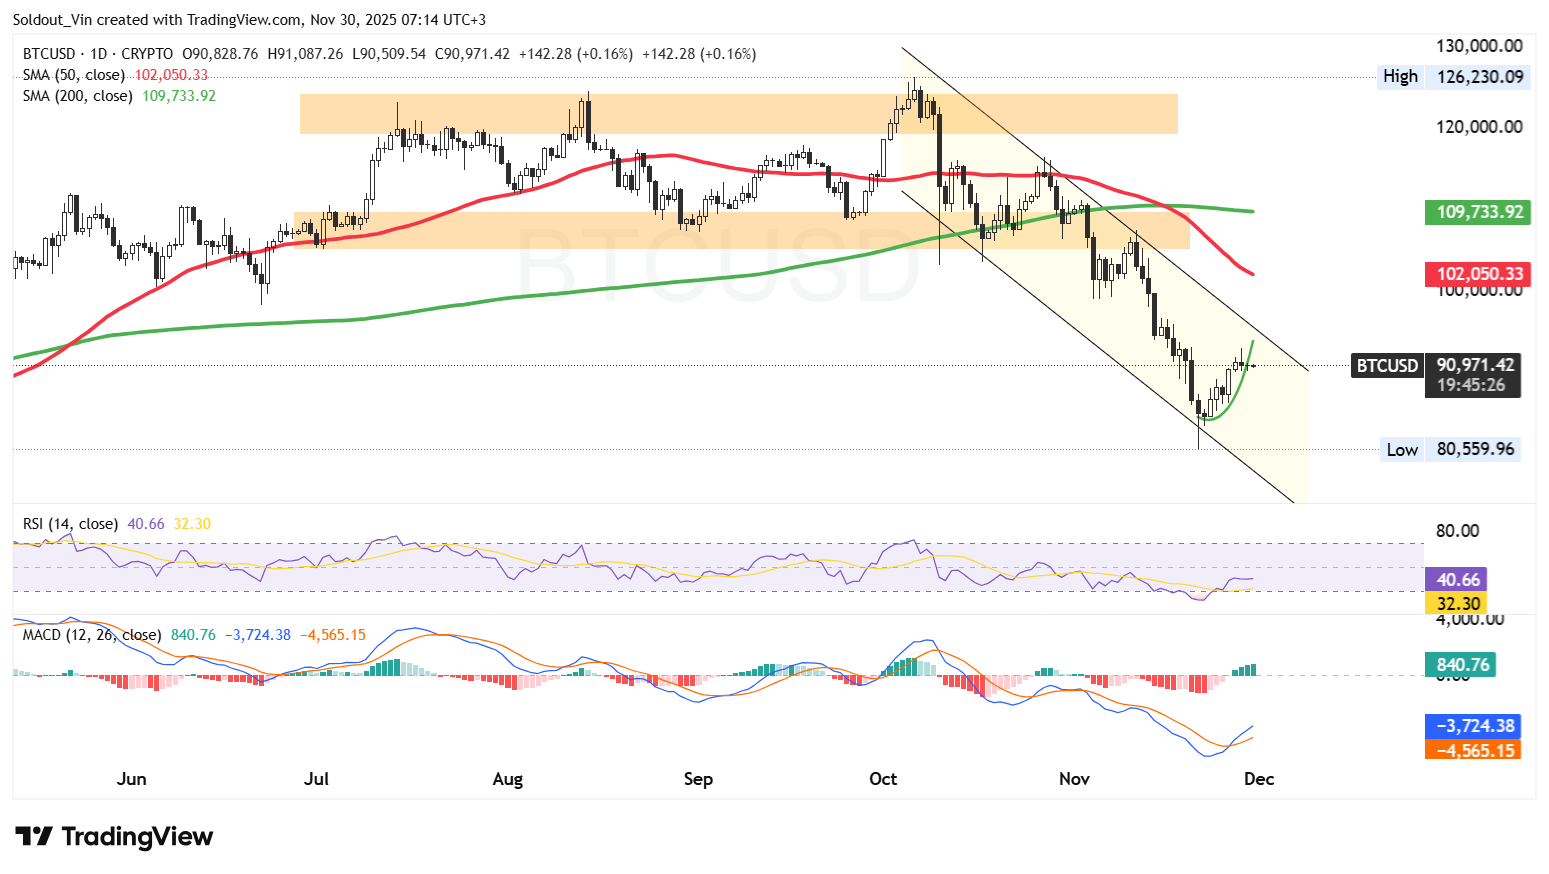
After reaching an ATH above the $126,000 region, the BTC price has since lost bullish momentum, forming a steady series of lower highs. This is a signal that sellers have taken control.
As the Bitcoin price continued to trend downward within a bearish channel, it began trading below both the 50-day and 200-day Simple Moving Averages (SMAs), confirming a shift into a medium-term bearish trend.
The rejection from the 50-day SMA continued to guide the price of BTC even lower, with each test resulting in renewed selling pressure.
However, once Bitcoin reached the lower end of the channel near the key support area around $80,553, the asset began showing early signs of stabilization. This zone acted as a major reaction level, previously triggering strong buying interest and now serving as an important technical support area.
Momentum indicators also support the overall early stabilization. The Relative Strength Index (RSI) has climbed from recent lows and now sits near 40, indicating that while the market remains bearish, buyers may be regaining control.
Meanwhile, the Moving Average Convergence Divergence (MACD) shows initial signs of a recovery attempt, with the blue MACD line crossing above the orange signal line, which is an early sign that momentum is shifting.
BTC Price Prediction
According to the BTC/USD chart analysis on the daily chart, the BTC price is currently attempting a short-term recovery from the lower boundary of the falling bearish channel.
If buyers manage to sustain this bullish trend reversal, the Bitcoin price may attempt to retest the $102,050 resistance zone on the 50-day SMA.
A successful break above this area could allow the price of BTC bulls to even push the token toward the next barrier around the 200-day SMA near $109,700.
Conversely, if bearish pressure returns, BTC could revisit deeper support near $80,500, the recent swing low, and the lower boundary of the descending channel.
A breakdown below this level would expose Bitcoin to further downside risk, with $77,473 acting as a cushion against downward pressure.
About Author

About Author




