


67,000 BTC Whale Sell-Off Meets Silent Market and New Buyer Class
A 67,000 BTC single-day distribution by mid-tier whales collides with new whale accumulation and record-low crypto social volume — is Bitcoin at a turning point?

Bitcoin held near $64,609 on July 15 – touching an intraday high of $64,832 and a session low of $61,823 in recent trading – while crypto social discussion across X, Reddit, and Telegram simultaneously fell to its second-lowest daily reading since October 2024, according to Santiment, a configuration that superficially resembles a market in suspended animation but conceals a pair of structurally significant events unfolding beneath the surface: a 100-to-1,000 BTC wallet cohort distributed roughly 67,000 BTC in a single session on July 13, equal to approximately $4.3 billion at current prices and roughly 0.33% of Bitcoin’s circulating supply of nearly 20 million BTC, while a separate CryptoQuant analysis identified newer whale wallets continuing to accumulate during the same window, producing a supply rotation between large-holder cohorts that the social silence makes nearly invisible to retail observers – and the question the combined data forces is whether the wallets accumulating during this quiet stretch carry enough capacity to absorb what the distributing cohort is still moving out.
67,000 BTC in One Day: The Mechanics of the Whale Split
The 100-to-1,000 BTC wallet cohort represents a structurally distinct layer of the market: wallets holding 100 to 1,000 BTC. According to CryptoQuant, this cohort’s July 13 distribution of roughly 67,000 BTC was the strongest single-day selling activity from that group since February, suggesting that a meaningful portion of these holders used Bitcoin’s rebound toward the mid-$60,000s as an exit window rather than a confirmation of renewed trend.
At $64,609 per coin, that single-day flow amounts to approximately $4.3 billion in realized distribution – a figure that becomes more legible when placed against the US-traded spot Bitcoin ETF inflows recorded over the same period. Farside Investors data shows spot Bitcoin ETFs pulled in approximately $197.4 million over the July 6–10 week, a figure that was already modest relative to historical peaks, and then reversed sharply on July 13 with roughly $424.7 million in net outflows in a single session. The whale cohort moved approximately 22 times the prior week’s entire ETF inflow in one day, which frames the scale mismatch between institutional product demand and large on-chain distribution with considerable precision.

The internal split within the whale universe adds a layer that the headline number alone obscures. CryptoQuant‘s separate analysis identified newer whale wallets – larger holders established more recently in this cycle – continuing to accumulate even as the established 100-to-1,000 BTC cohort was selling. That dynamic describes a supply rotation: coins leaving holders who have been sitting on positions long enough to have a cost basis significantly below current prices and moving toward newer large buyers with shorter holding periods and, arguably, a more forward-looking thesis. It is not uniform capitulation, but it is not uniform conviction either – it is a market divided at the large-holder level on whether $64,000 represents an exit or an entry.
Social Silence as a Signal: What Santiment’s Data Actually Says
Santiment frames extremely low levels of crypto social discussion as a form of market quiet that can precede turning points – the mechanical logic being that a less crowded trade, with fewer retail participants actively chasing or shorting price, leaves more room for a smaller demand increment to move price further than it would during a period of peak attention.
The mechanism is real but conditional. Low social volume reduces the friction of accumulation – fewer participants monitoring order books, fewer traders reacting to price ticks – but it does not manufacture demand where none structurally exists. The social silence becomes a genuine setup indicator only if the wallets buying during the quiet period are large enough and consistent enough to absorb the supply the distributing cohort is moving. If accumulation by newer whales stalls, or if ETF flows remain negative for several more weeks, the same low-attention environment that looks contrarian on the way up reads as simple indifference on the way down.
Santiment also flags macro uncertainty, ETF flow volatility, and a still-cautious broader risk appetite as active headwinds working against Bitcoin during this window. The firm’s read is that the quiet is ambiguous – it is a necessary but not sufficient condition for a sustained move higher, and its weight in the analytical framework depends entirely on what the on-chain demand picture confirms or denies over the following weeks.
A Redistribution Cycle Running Since Mid-2024
The July 13 distribution event did not emerge from a static supply structure. The broader backdrop, established over the prior two years, shows a structural rotation in Bitcoin ownership that has been reshaping which cohorts carry the most supply risk and which are best positioned to absorb it. The pattern running from mid-2024 through early 2026 shows supply migrating out of the largest legacy holders and into the mid-sized institutional layer that the 100-to-1,000 BTC cohort represents – a multi-year redistribution that the July data captures in its most acute single-session expression.
That structural shift carries implications for how July 13’s 67,000 BTC distribution should be read. In prior cycles, a comparable single-day flow from the largest holders often signaled a decisive directional move because supply was concentrated enough that one cohort’s behavior could define the market. The current structure is more fragmented: the 100-to-1,000 BTC cohort distributed heavily, but a separate newer cohort continued accumulating in the same session, producing a net effect that is directionally ambiguous at the aggregate level and structurally complex at the cohort level.
ETF Flow Reversal Exposes the Institutional Demand Gap
The ETF channel’s performance during the same window reveals how far institutional product demand has retreated from its peak. Glassnode‘s tracking puts 30-day ETF net flows in negative territory as of the reporting period, with daily trading volume running between $650 million and $950 million – approximately 80% below the October 2025 peak. The July 13 single-session outflow of $424.7 million, per Farside Investors, represents a reversal that erased the prior week’s gains and then some, leaving the cumulative flow picture decidedly negative when measured across the past month.
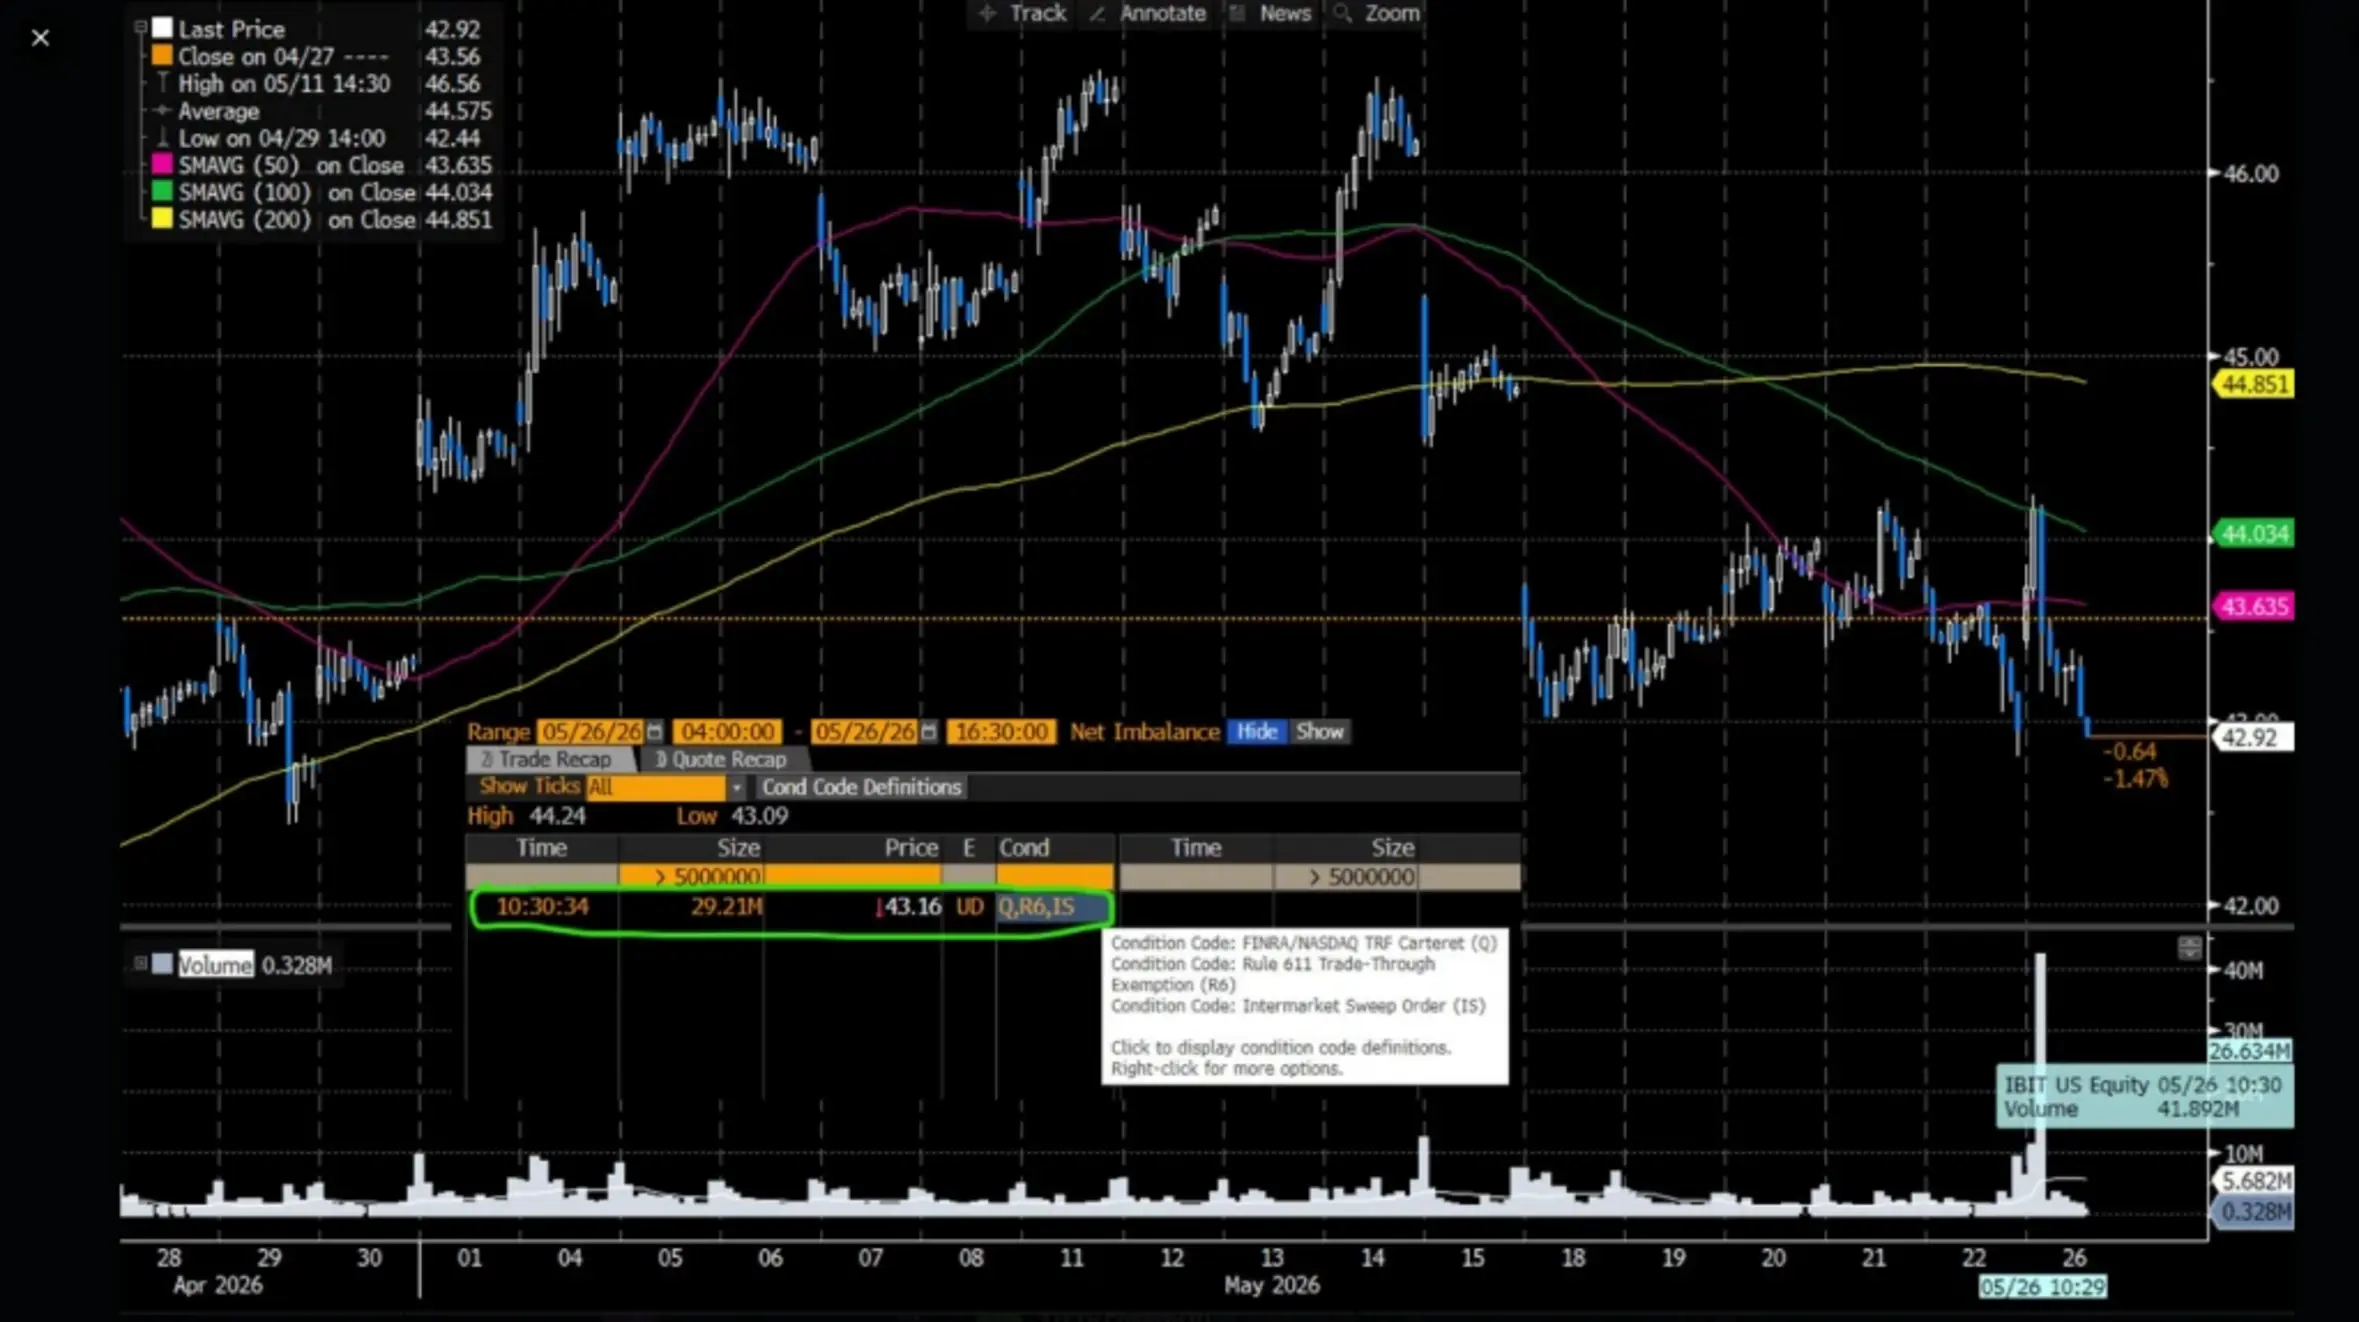
The scale gap between what the 100-to-1,000 BTC cohort moved in a single session and what the ETF channel absorbed over an entire week frames the structural problem precisely. ETF outflows have been a persistent feature of this market phase, and the July 13 data suggests that the institutional product channel is not yet operating at the scale needed to serve as a counterweight to on-chain distribution by large holders. For the ETF layer to absorb even a fraction of what the whale cohort moved on July 13, daily inflows would need to return to ranges not seen since the peak activity window of late 2025.
The macro environment provides a partial explanation for the ETF demand shortfall. The Federal Reserve held its target rate at 3.50% to 3.75% at its June 17 meeting, maintaining a real-yield environment that competes with risk assets for capital allocation. June CPI cooled to 3.5% year-over-year from 4.2% in May, easing some pressure, but not enough to materially shift institutional risk appetite toward Bitcoin-exposed products. US M2 supply has risen to a record $22.8 trillion, but the Fed’s balance sheet remains roughly $2 trillion below its 2023 peak, leaving the liquidity picture expansionary at the broad money level while still restrictive at the reserve level – a bifurcation that historically produces choppy, range-bound conditions in risk assets rather than clean directional trends.
Cost Basis Levels and Long-Term Holder Losses Define the Recovery Threshold
Glassnode identifies two specific levels that define what a completed recovery looks like structurally: the short-term holder cost basis near $72,200 and the True Market Mean near $76,600. Bitcoin has been trading below both levels for much of the recent period, a duration that reflects sustained pressure on holders who bought during the last run-up and have been sitting at a loss since. The persistence of that underwater position is what makes the current accumulation-versus-distribution dynamic consequential – buyers establishing positions in the low-$60,000s are acquiring coins at a meaningful discount to both benchmark levels, but those levels need to be reclaimed before the structural picture shifts from “bottom-building” to “confirmed recovery.”
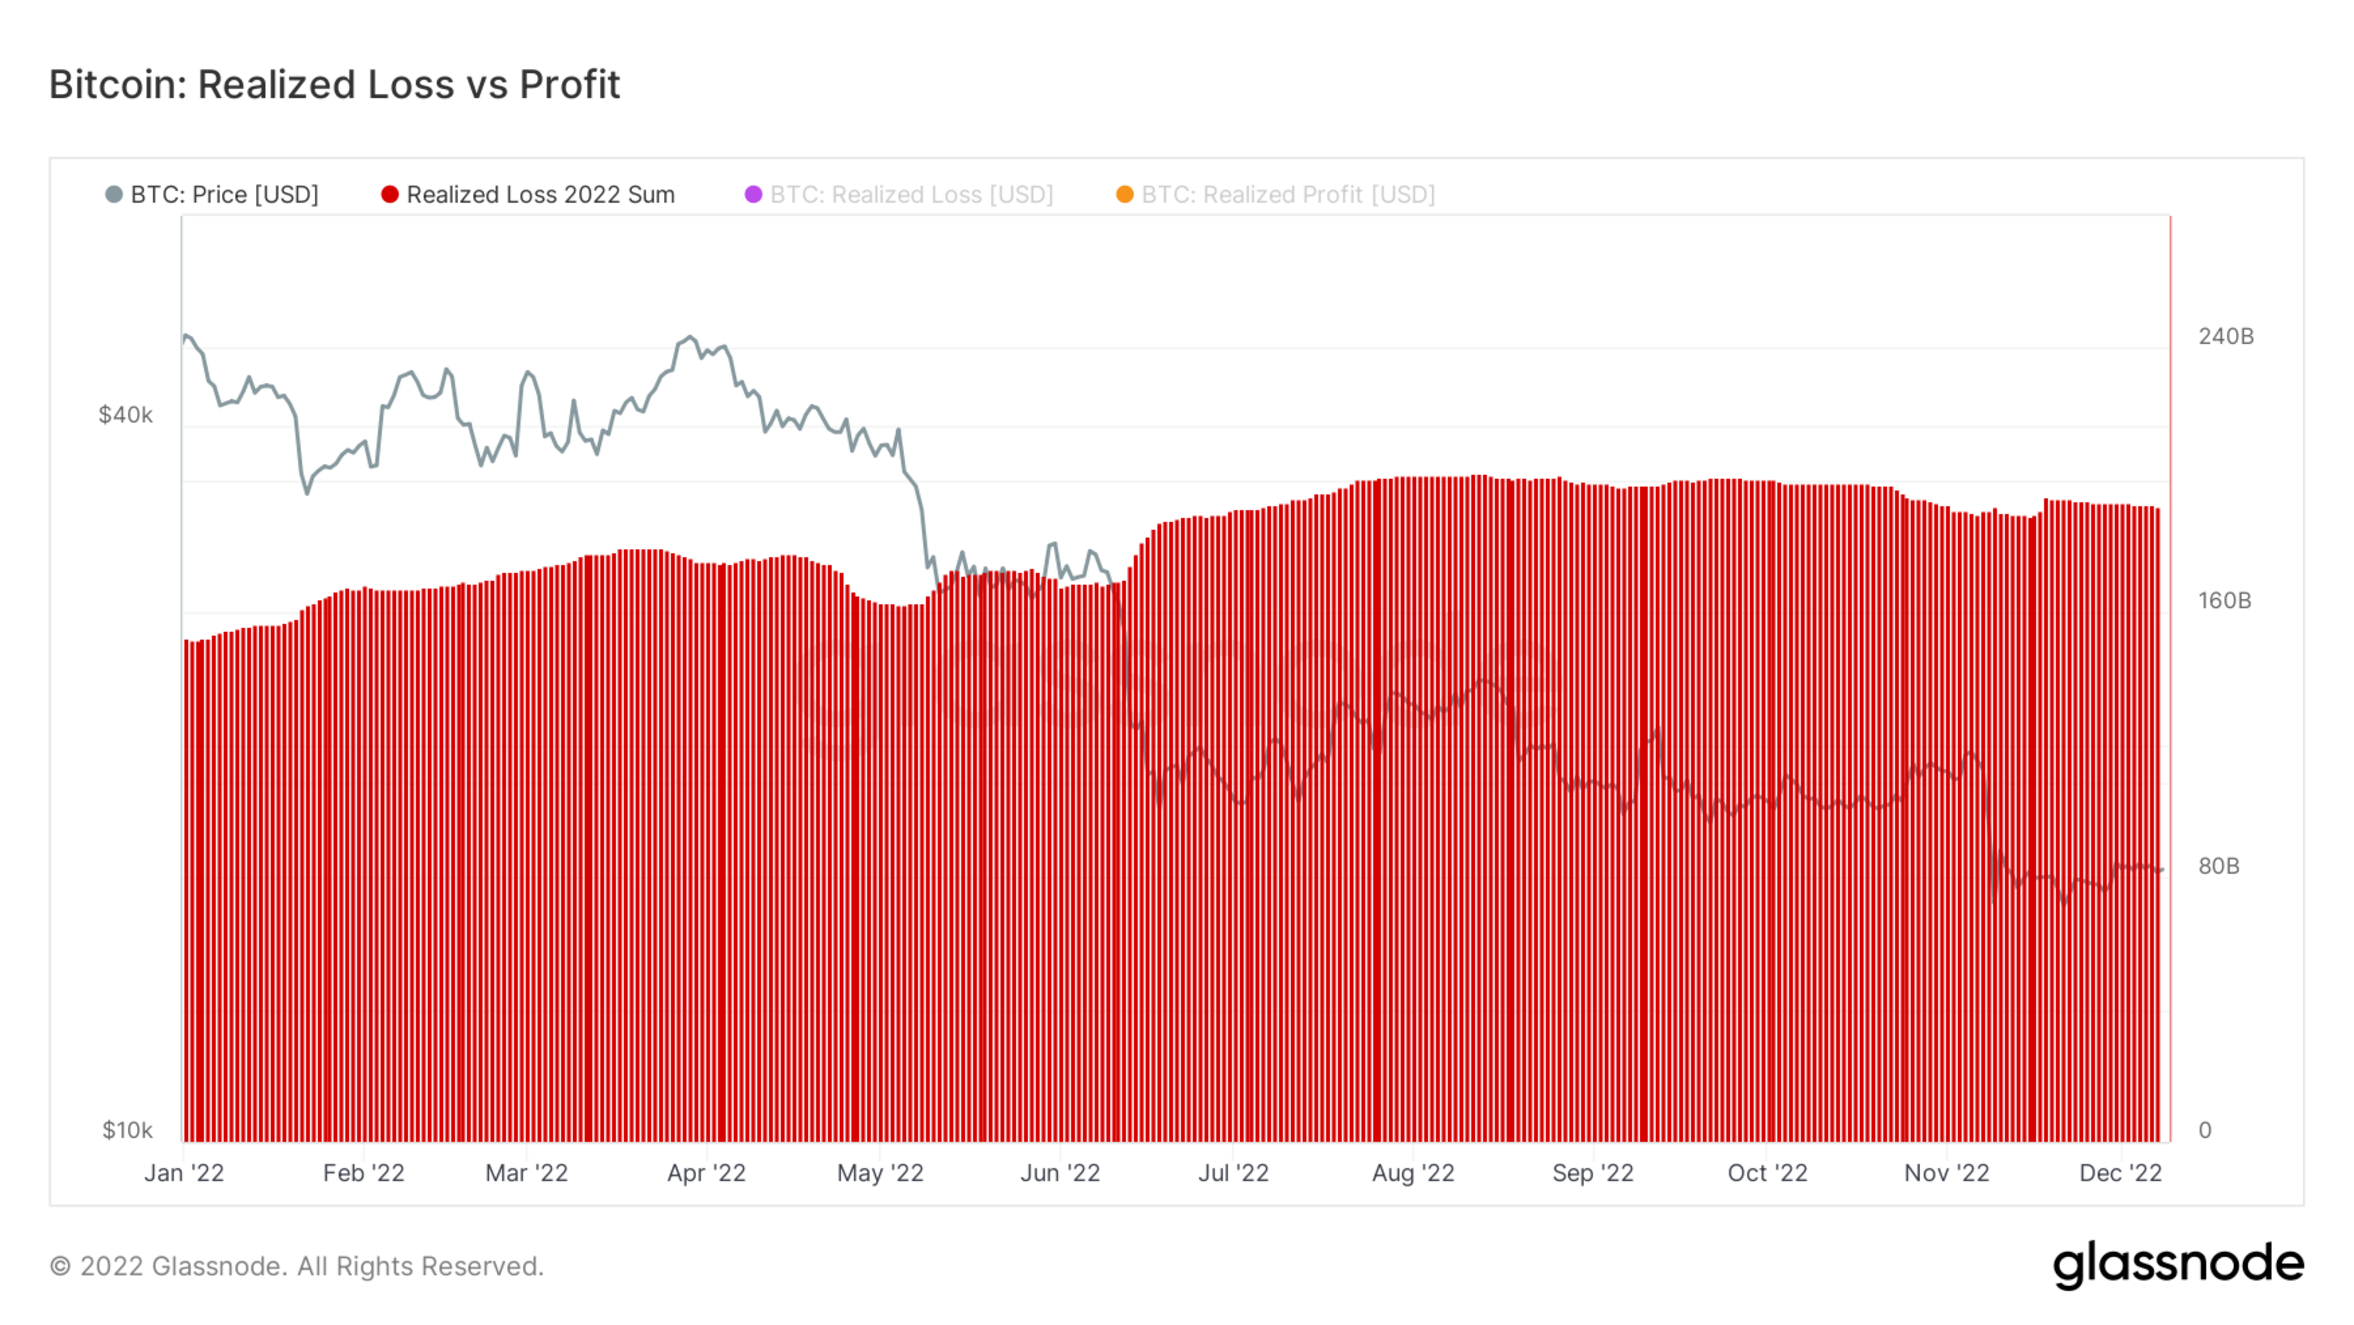
Long-term holder realized losses peaked near $280 million per day during this stretch, the highest since December 2022, according to Glassnode. That figure signals how far capitulation has already progressed – the holders exiting at these levels are doing so at realized losses of a scale not seen in three and a half years, which historically indicates that a meaningful portion of the weak-hand supply has already been transferred to stronger hands. The caveat is that the pace of capitulation, while historically significant in its magnitude, had not yet cooled to a level that confirms the process is finished at the time of writing, leaving the signal directionally informative but not yet conclusive.
The institutional perspective on the current correction distinguishes this cycle’s drawdown from prior bear markets on the basis of ownership structure. The presence of a larger mid-sized institutional cohort – the new whale class – means the supply overhang is held by a group with more diversified cost bases and different liquidity constraints than the retail-dominated holder base of earlier cycles. That structural difference does not eliminate the risk of further downside, but it does alter the mechanics by which capitulation unfolds and the conditions under which it terminates.
The Bear Case Remains Live: What Invalidates the Accumulation Thesis
The conditions under which the current accumulation narrative fails are specific and identifiable. If the 100-to-1,000 BTC cohort’s distribution does not cool – if the pace of selling from established holders continues at July 13 levels for several more sessions – the newer whale accumulation documented by CryptoQuant will face a supply wall that absorptive capacity may not be sufficient to clear. The ETF channel, running at 80% below peak volume and with 30-day flows in negative territory, cannot serve as a meaningful buffer under that scenario.
Glassnode‘s weekly report flags oil shocks and broader risk-off behavior as live macro threats, noting that Bitcoin has recently traded in close step with broader risk assets, behaving as one more risk asset among many. The Fed’s restrictive posture, even with CPI softening, leaves real yields elevated enough to compete with Bitcoin’s return profile for institutional allocators who are not ideologically committed to the asset.
Citi’s July revision – which cut its 12-month Bitcoin price target to $82,000 from $112,000, citing weak investor appetite and stalled US crypto legislation – puts the bear case at $53,000 under recessionary conditions. That scenario activates if distribution continues, ETF flows revert to sustained negative territory, and long-term holder capitulation remains at or near its peak pace. Under those conditions, the low-$60,000s become the next level the market will be forced to price as resistance rather than support, and the social silence that currently reads as contrarian setup reads instead as straightforward demand absence.

Three Scenarios, One Governing Question
The path toward reclaiming $72,200 and then $76,600 requires a specific sequence: newer whale accumulation persists and broadens, the 100-to-1,000 BTC cohort’s distribution rate declines from its July 13 peak, and ETF flows turn net positive for several consecutive weeks. If that sequence holds, Bitcoin has a mechanical path toward Citi’s $82,000 base case – a level the bank treats as achievable within a 12-month window, with room to extend beyond it if legislation and institutional appetite recover simultaneously. The social silence, under that reading, would have functioned exactly as Santiment‘s framework suggests: a low-attention window that allowed larger buyers to position before retail attention returned.
The intermediate scenario – Bitcoin holding the low-$60,000s without meaningful upside progress – describes a market building a base without confirming one. ETF flows remain choppy, whale cohorts stay internally divided, and long-term holder losses run at an elevated but declining pace. Under that reading, the redistribution between old and new whale cohorts continues, but neither side generates enough dominant force to define the next directional leg, and the market spends additional months consolidating near current levels before a catalyst arrives externally.
The third scenario – distribution accelerating, ETF flows reverting, and LTH capitulation persisting – produces the $53,000 level that Citi identifies as its bear case floor. That outcome would confirm that the low social media engagement was not a contrarian indicator but simply an accurate reflection of structural demand weakness: fewer participants discussing Bitcoin b




