BNB Chain Price Prediction: BNB Surges To New All-Time High On Aster Momentum

The BNB Chain price roared to a new all-time high (ATH), climbing 5% to trade at $1,217 as of 09:45 a.m. EST
The rally, which peaked at an ATH of $1,237.81, was fueled by a surge in activity on the BNB Chain that was driven by Aster Protocol’s decentralized perpetual futures exchange (DEX).
It is backed by YZi Labs, a family office investment firm overseen by Binance co-founder Changpeng Zhao, aka CZ.
Aster’s multi-chain liquidity aggregator, low fees, and up to 100x leverage have drawn both retail traders and whales, helping its total value locked (TVL) soar to $2.34 billion since launch in September.
In September, BNB Chain’s daily active addresses hit 52.5 million, surpassing Solana. The opBNB Layer 2 solution also saw a 66.4% spike in users last month, with transaction fees outpacing competitors.
This utility-driven demand, coupled with a record $67 billion in perp DEX volumes, has turned BNB Chain into DeFi’s hottest ecosystem.
With network metrics soaring and technical indicators flashing bullish signals, analysts are eyeing further upside, potentially reaching $1,500 by 2027. Crypto analyst Javon predicts BNB will soar to $1,520.
Still, there was controversy around Aster earlier in the day, when DefiLlama builder 0xngmi flagged it for suspicious trading activity.
DefiLlama, a popular decentralized finance (DeFi) data aggregator, said it will delist Aster’s perpetual volumes.
It said an investigation into its trading volumes showed that the activity has started mirroring Binance perp volumes almost exactly.
This suggests that the trading volume might not be organic, but rather come from Binance itself.
BNB Chain Bulls Eye $1,355 Target
BNB’s recent price action paints a robust bullish picture, with the BNB/USD pair decisively breaking through a key resistance level at $1,223.
This breakout is significant as it has flipped this former resistance into a potential support zone, a classic bullish signal in technical analysis.
The Fibonacci retracement levels, drawn from the swing low of $737, provide a roadmap for potential price targets and support levels. The $1,223 level aligns closely with the 0.618 Fibonacci retracement, a critical level often watched by traders for reversals or continuations.
BNB is trading considerably above its 50-day simple moving average (SMA) at 941.76 and the 200−day SMA at 736.21, which indicates the price is in an uptrend. The price SMAs offer support levels and the price is in a strong uptrend, which supports the uptrend.
The widening gap between the price and these moving averages indicates strong upward momentum, though it also raises the possibility of a pullback if the market becomes overextended.
The Relative Strength Index (RSI) at 73.84 indicates that BNB is in the overbought territory (typically above 70). While this suggests strong buying pressure, it also warns of potential consolidation or a short-term pullback as traders may take profits.
However, the Moving Average Convergence Divergence (MACD) provides further bullish confirmation. The MACD line (blue) is soaring above the signal line (orange), and the histogram bars are widening, indicating increasing bullish momentum.
This suggests that the current rally has room to run, though traders should watch for any signs of divergence as a potential warning of weakening momentum.
Fibonacci extensions point to short-term targets of $1,355.70 (-0.272 level) and $1,523.78 (-0.618 level), representing an 11.4% upside if the rally persists.
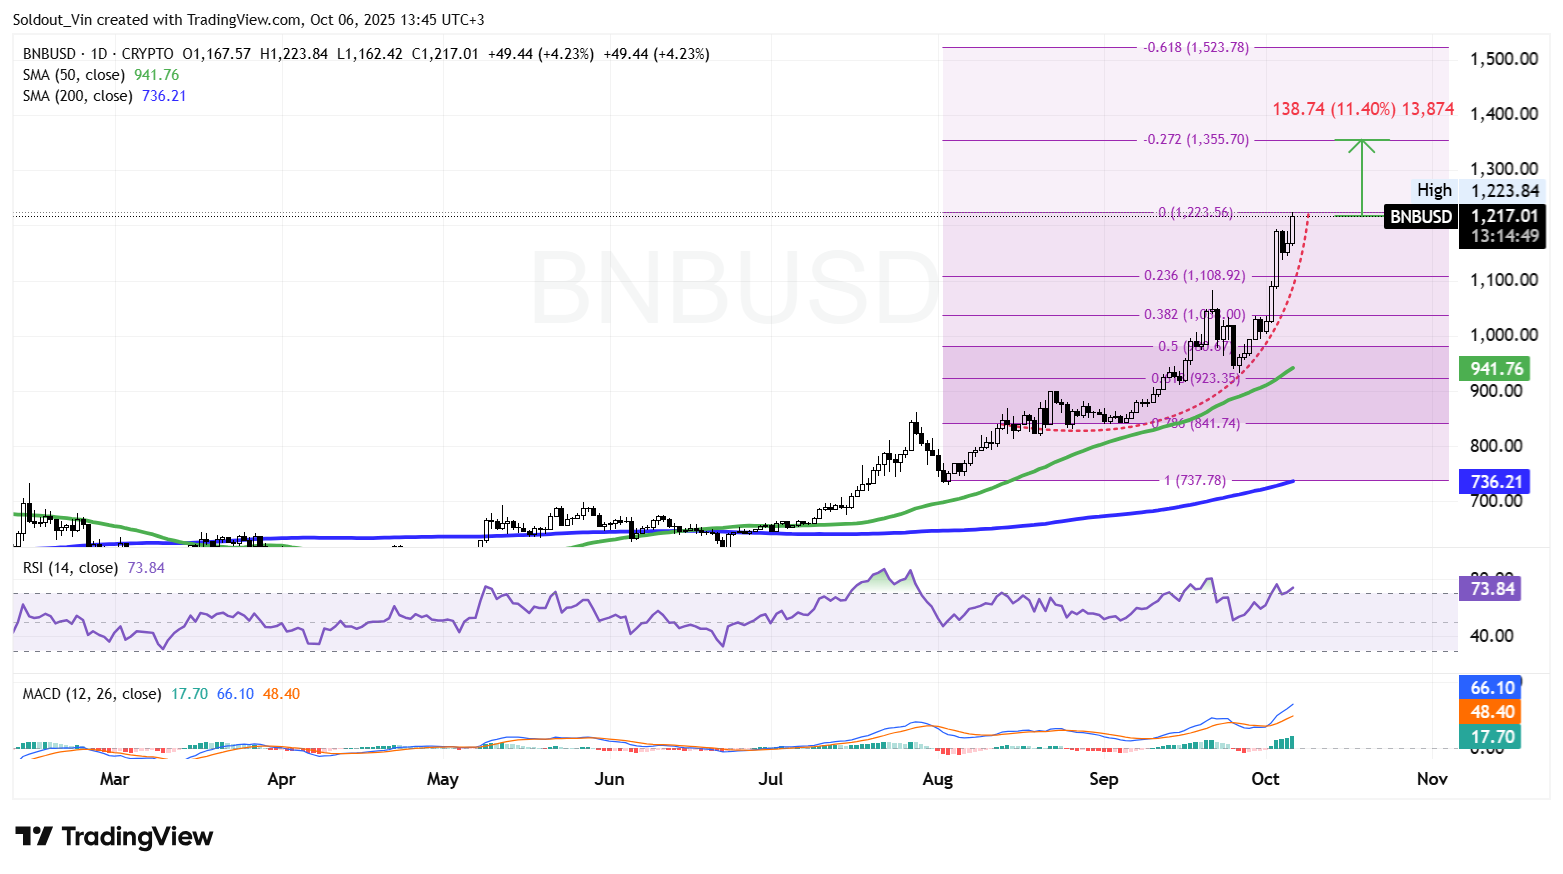
Conversely, if BNB fails to hold the $1,223 support, it could retest the 50-day SMA at $941.76 or even the 200-day SMA at $736.21 in a worst-case scenario. A bearish MACD crossover or declining volume would signal caution.


