BNB Chain Tops Activity Charts as BNB Price Targets $1,150 Rally

The BNB price has surged 1% in the last 24 hours to trade at $843 as BNB Chain emerges as the most active blockchain in 2025 based on daily user activity, surpassing both Ethereum and Solana.
Data from CryptoRank and TokenTerminal shows that BNB Chain averaged about 4.32 million daily active wallets this year, making it the top Layer-1 network by this key adoption metric.
Solana ranked second with around 3.23 million daily wallets, while NEAR Protocol followed closely in third place with 3.15 million. The data highlights a growing gap in adoption, with BNB Chain pulling further ahead as user engagement continues to rise across its ecosystem.
This strong performance reflects not just retail use but also increasing institutional interest. A major example is BlackRock’s BUIDL product launching on BNB Chain, which has boosted confidence in the network’s long-term potential.
The update sparked positive reactions across the crypto community, including from Binance founder Changpeng Zhao (CZ), who celebrated the milestone and expressed optimism for even stronger growth in 2026.
Beyond user numbers, recent developments, such as Kalshi enabling BNB and USDT support, and Binance securing a global license in Abu Dhabi, point to rising real-world utility, supporting sustained and organic ecosystem growth.
BNB Price Holds Crucial Support Near $825, Setups Point to a Rally Ahead
BNB is currently trading near the $840 level after an extended correction from its recent peak above $1,200. The daily chart shows that the price has settled into a key support zone between $820 and $830, an area that previously acted as strong resistance before the major bullish breakout earlier in the year. This makes the zone technically important, as former resistance often turns into support.
The chart shows the BNB moved through a long consolidation phase before entering a strong parabolic uptrend. That rally accelerated from mid-year into October, driven by rising momentum and strong participation. However, after reaching its high, the price entered a corrective phase marked by lower highs and selling pressure as traders took profits.
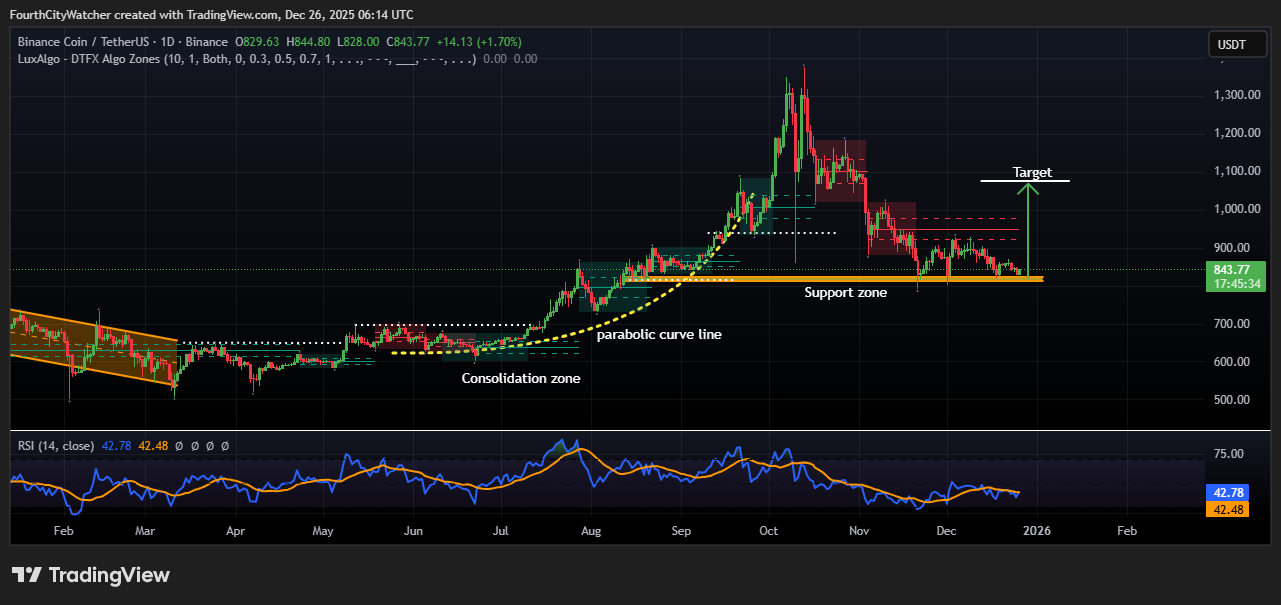
The current price action suggests that this correction is losing momentum. Candles are compressing near support, indicating reduced selling pressure and growing buyer interest. As long as BNB holds above the $820–$830 support zone, the broader bullish market structure remains intact.
A decisive breakdown below this level would weaken the outlook and could open the door to deeper retracements. On the upside, the first resistance to watch lies around $900–$920, where the price previously faced rejection. Beyond that, a stronger supply zone sits between $1,000 and $1,050.
A daily close above this region would likely confirm renewed bullish strength and could push BNB toward the $1,100–$1,150 target highlighted on the chart. The RSI (14) is hovering near 42, showing weak momentum but also signaling that BNB is no longer overbought.


