BNB Price Dips as YZi Labs Pushes for Control of CEA Industries in New Governance Clash

The BNB price has slipped 1.2% in the last 24 hours to trade at $821 on a 21% surge in the daily trading volume to $2.32 billion.
This is as Binance founder Changpeng Zhao’s YZi Labs tried to take control of CEA Industries (BNC), the company it helped fund to build a huge BNB treasury. In a new filing, YZi asked shareholders to cancel recent bylaw changes, add more board seats, and vote in its own candidates. It says these changes are needed because CEA’s management is hurting shareholder value.
CEA’s stock has crashed 89% since July, falling from a high of $57.59 to $6.47. The company’s significant jump in July followed the announcement of plans to become the largest public holder of BNB, supported by a $500 million investment deal backed by YZi. But since then, the stock has dropped sharply.
YZi claims CEA’s team has been slow with updates, done little marketing, and may not be fully loyal to the company. It even says the board should consider replacing CEO David Namdar.
BNB itself is trading at about $829, down nearly 40% from its October peak but still up 17.8% this year. CEA holds 515,054 BNB bought at an average of $851, leaving its mNAV ratio at 0.79x.
BNB Price Holds Key Support and Forms Early Parabolic Reversal Signal
BNB/USDT trading pair is shows early signs of a potential reversal after weeks of downside pressure, as price continues to hold above a major long-term support zone near the $800–$820 range. This area aligns closely with the 200-day SMA (green line), which has historically acted as a strong dynamic support on higher timeframes. The latest candles show rejection wicks around this support, suggesting buyers are actively defending the zone.
The emerging parabolic curve line indicates the market may be attempting to shift from a flat consolidation into a gradual, rounded recovery. If this curvature continues to hold, BNB could begin forming a series of higher lows, which often precede aggressive upside momentum.
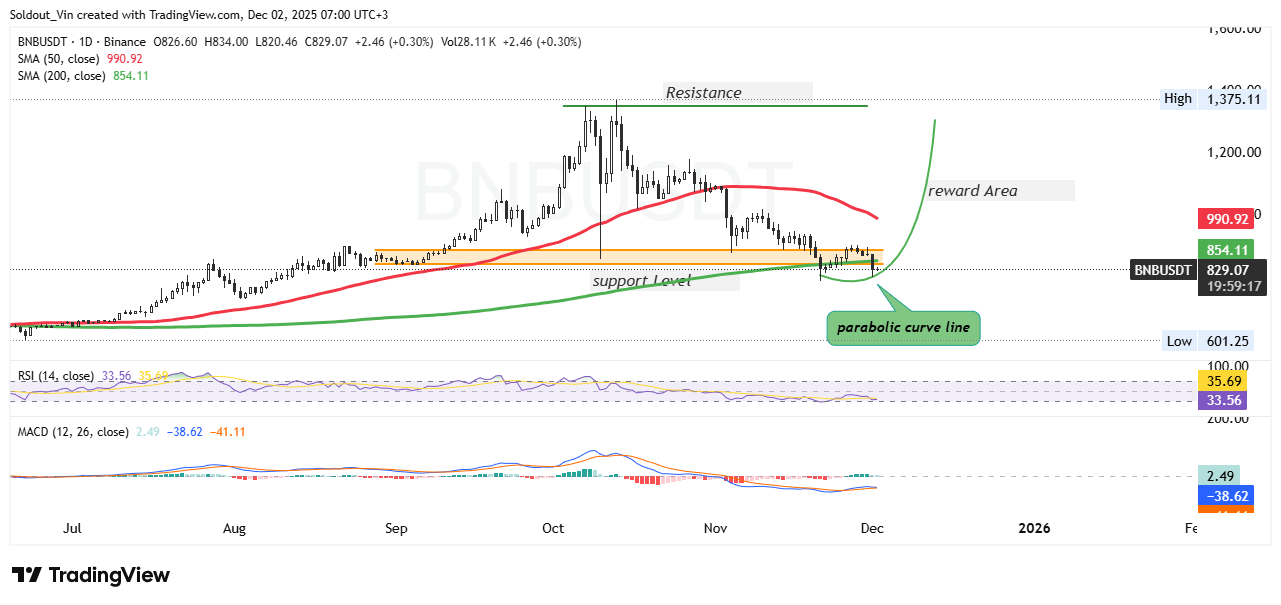
BNBUSDT Chart Analysis. Source: Tradingview
However, the 50-day SMA (red line) remains above the price and is currently sloping downward. This means BNB still faces a strong dynamic resistance overhead. A clean break and daily close above the 50-day SMA would be one of the earliest confirmations of trend reversal. The next immediate resistance lies in the highlighted resistance band around $1,050–$1,150, where the previous major swing highs formed. Above this zone sits the broader reward area, likely attracting momentum traders if price re-enters it.
The RSI is sitting near 33, which indicates the market has been oversold for some time. The indicator is flattening, showing that the selling pressure may be slowing down. If the RSI rises into the 40s or above, it could signal a shift toward stronger bullish momentum. The MACD also shows early improvement. The histogram bars are decreasing in size on the negative side, meaning bearish momentum is fading. The MACD lines are starting to curl upward, and a bullish crossover may form soon if buying pressure increases.


