Last Call for $600 BNB USD? Analysts Project +10% Moonshot to $716
BNB Price Prediction: Analysts Target $716 Peak

BNB USD has painted a tightening ‘Ascending Triangle’ on the daily chart, signaling a volatility squeeze that could trigger a decisive altcoin rally.
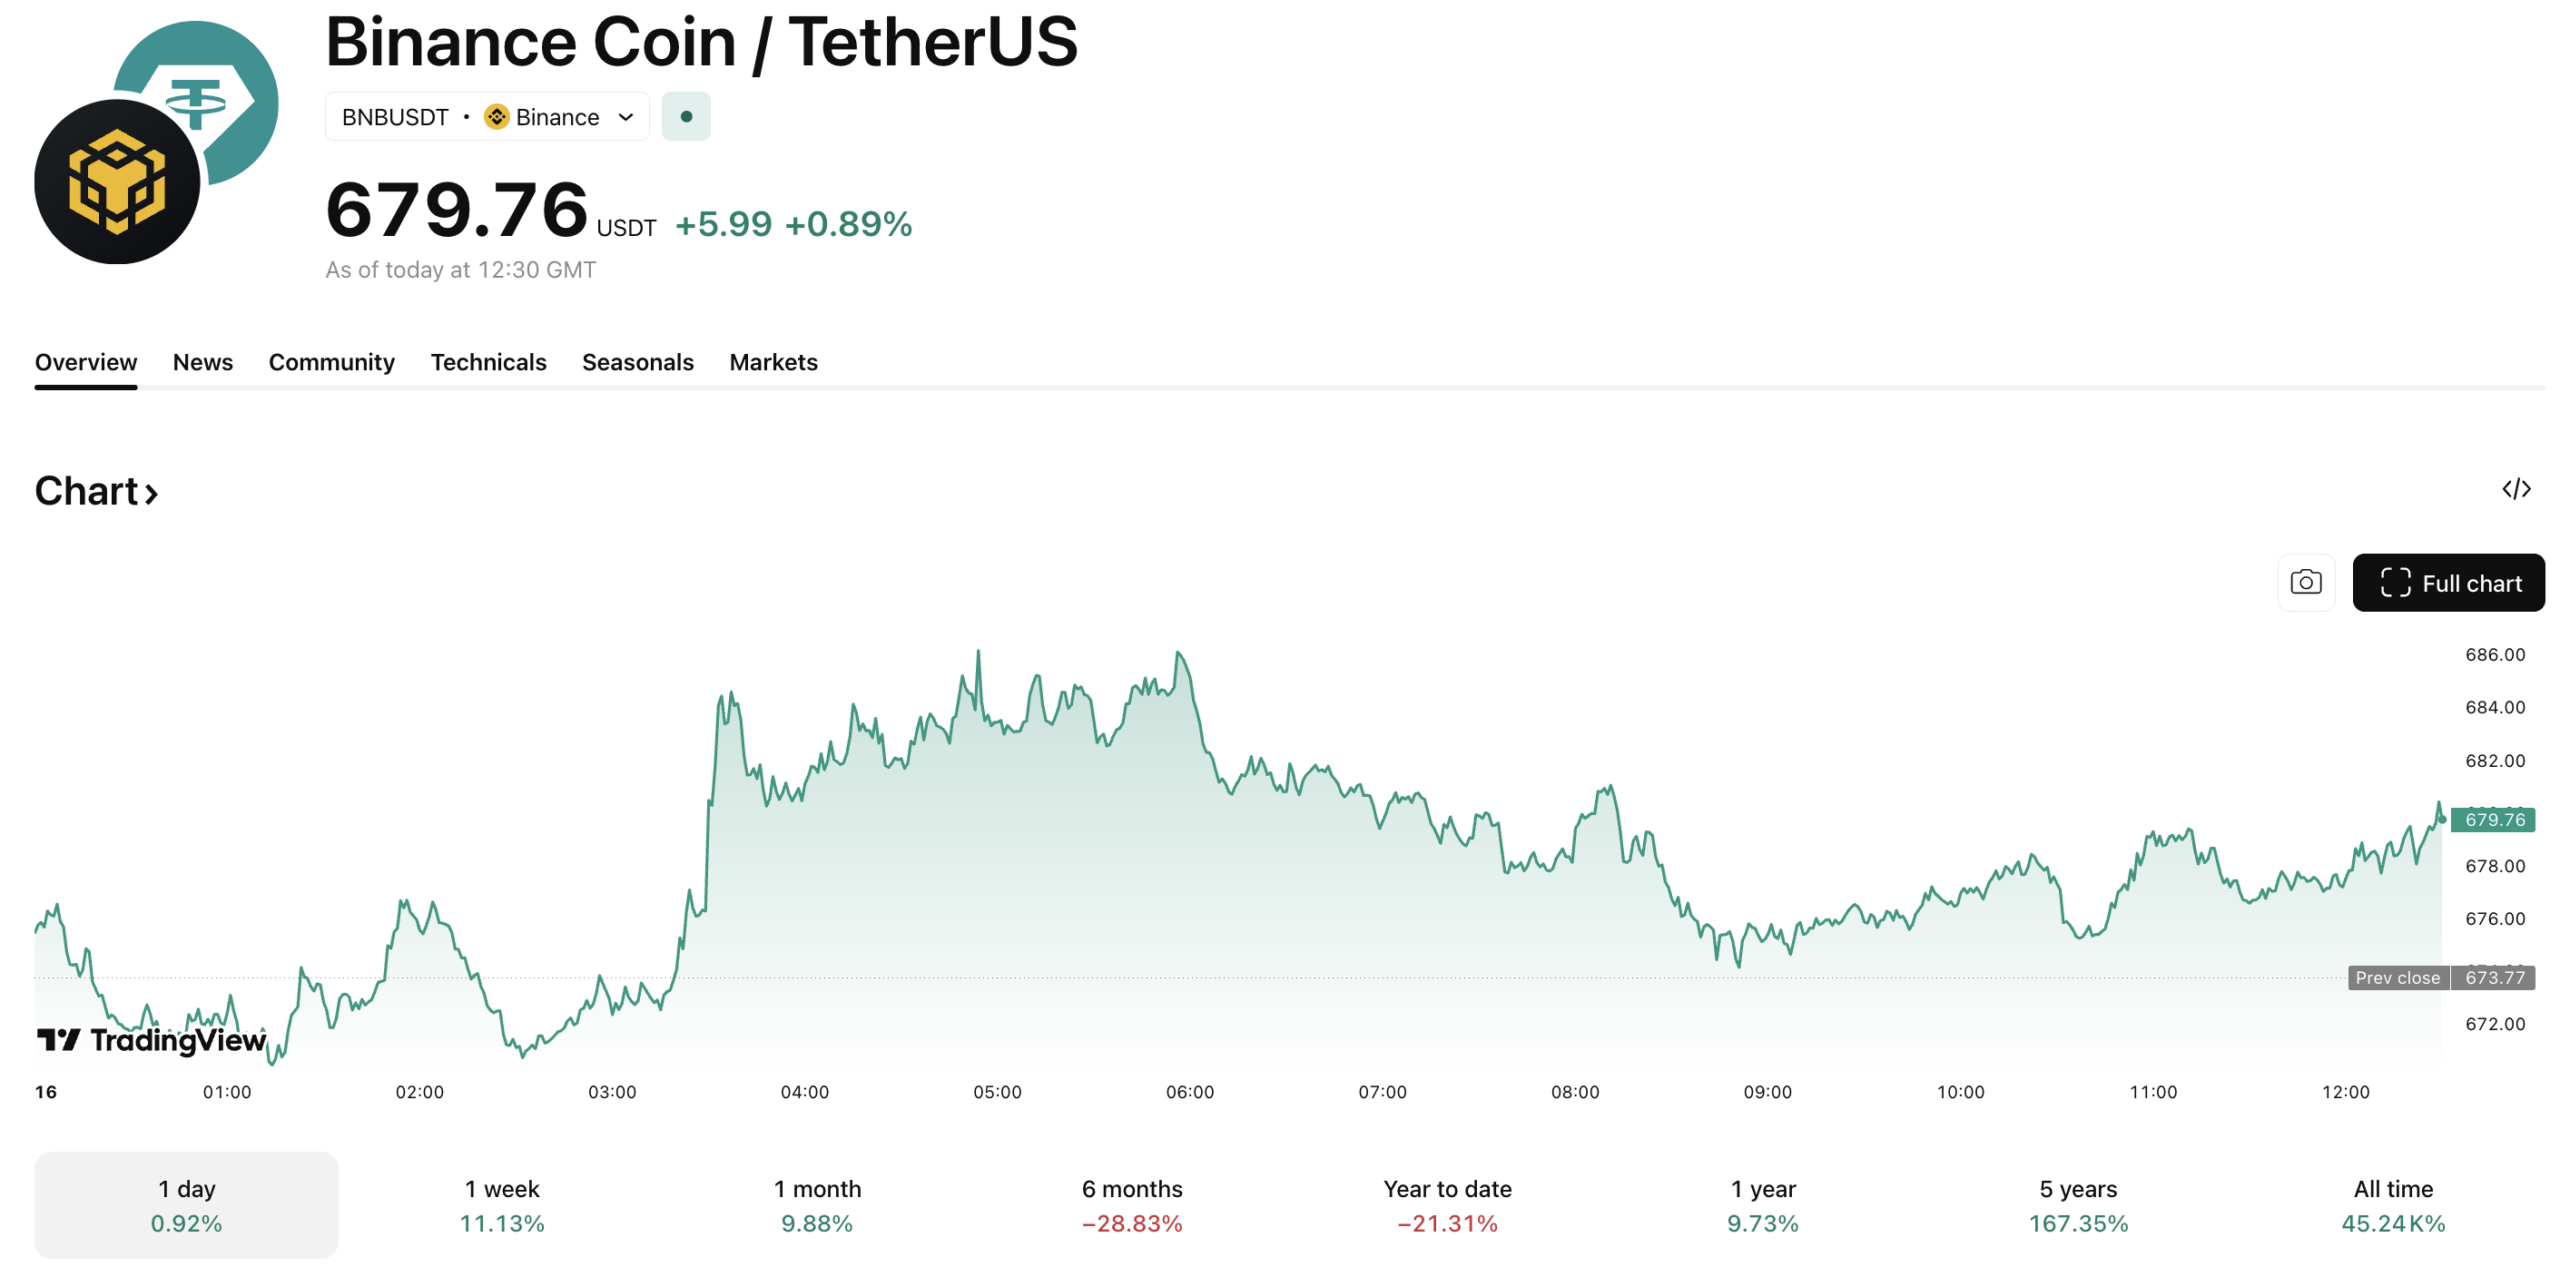
Currently trading at $675 following a +1.5% daily move, Binance Coin price analysis suggests the asset is hammering against the critical $680 supply wall.
The broader crypto market is moving in tandem with BNB USD, up +1.5% on the day, with the total combined market cap now back over $2.6 trillion, a level not seen since earlier this year.
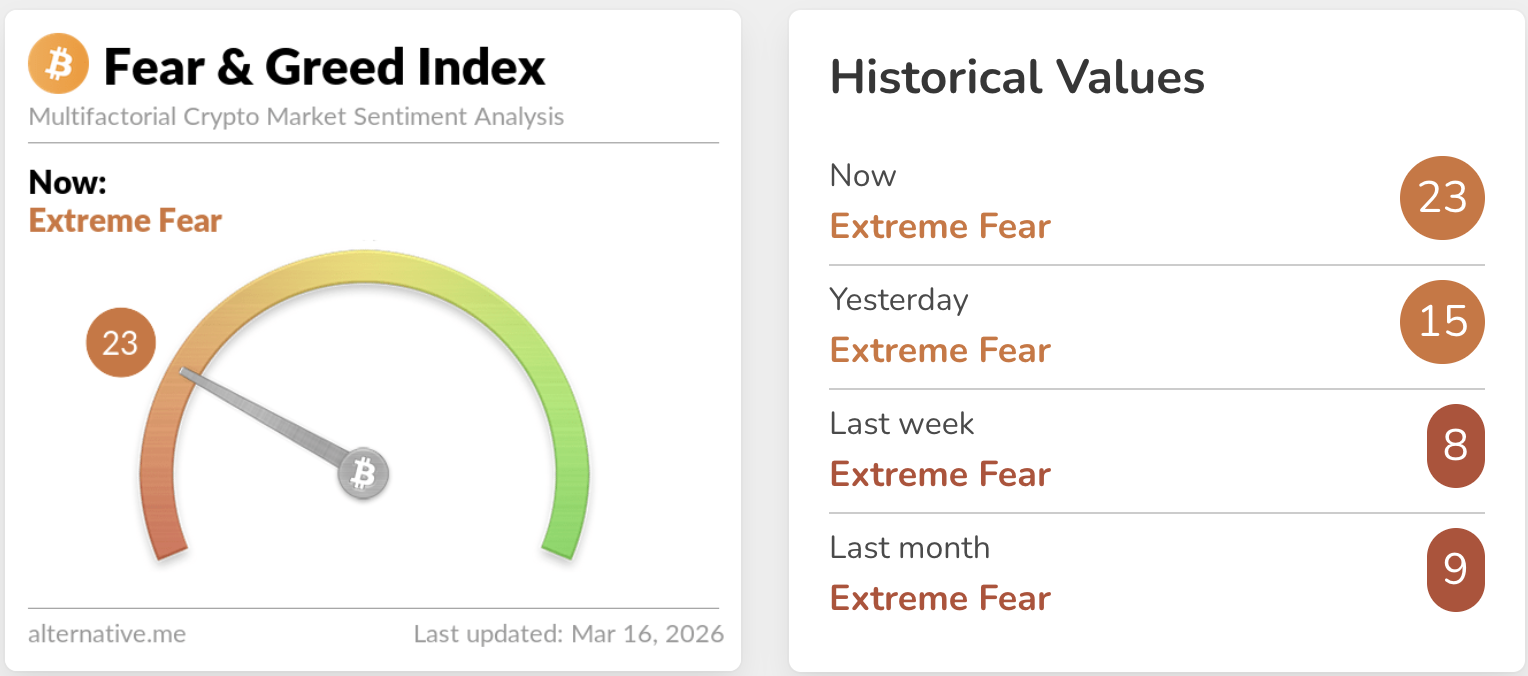
The Fear & Greed Index sits at a contrarian 23/100 (Extreme Fear), yet Open Interest has ticked up +4.5% in the last 24 hours, indicating that smart money is positioning for a violent breakout while retail traders remain on the sidelines.
BNB USD Price Prediction: Is $716 the Next Stop?
Comprehensive BNB price prediction models indicate the asset is coiling for a major move. The Relative Strength Index (RSI) currently reads 53.40, a neutral stance that leaves substantial room for upside before hitting overbought territory.
Bollinger Bands on the 4-hour timeframe are compressing rapidly, a classic precursor to high-volatility expansion. This consolidation phase generally signals a last entry opportunity before the trend resolves upward.
Technically, the immediate hurdle is the BNB USD resistance at $670. A sustained daily close above this zone would clear the path to the $716 target, representing an approximate 8% gain from current levels.
The 50-day Simple Moving Average (SMA) is providing dynamic support at $648.12, actively pushing price action into the resistance. However, traders should note the 200-day SMA looming overhead at $809.69, which remains the medium-term magnet for this recovery.
The setup is strikingly similar to the cup-and-handle pattern targeting $700 that formed earlier this quarter. Bears would need to force a daily close below the invalidation level of $633.15 to negate this bullish outlook and send the price back toward range lows.
DISCOVER: See Why Whale Accumulation Data Supports a Move to $700+
Will History Repeat Itself? Whale Accumulation Confirms the Setup
The current price action is eerily reminiscent of the March 2024 breakout setup, where a similar period of low-volatility consolidation preceded a 45% surge in under three weeks.
During that fractal, price compression at key resistance prompted a fake-out to the downside before ripping higher. Today, on-chain metrics suggest the market is in the final stages of this accumulation cycle.
According to data from Santiment, cohorts holding between 1,000 and 10,000 BNB have been aggressively adding to their stacks in the $640–$660 range over the last 14 days. This whale accumulation activity often foreshadows a significant markup event, as large holders front-run the retail crowd.
Furthermore, the relentless BNB USD quarterly burn mechanism continues to reduce circulating supply, adding deflationary fuel to the fire.
Drop CoinNews a Follow on X and Telegram for all of the Latest Crypto Market Updates and Professional Market Analysis.


