BNB Price Slumps 2% as BlackRock’s BUIDL Fund Expands to BNB Chain

BNB price has slumped 2% in the last 24 hours, to trade at $915 on a 17% plunge in the daily trading volume to $2.54 billion
The plunge in BNB price comes as BlackRock’s BUIDL Fund launches on BNB Chain, expanding access to the world’s largest tokenized real-world asset. The new share class on BNB Chain gives investors direct on-chain exposure to tokenized U.S. dollar yields. The expansion is supported by Securitize and Wormhole, two major partners powering BlackRock’s growing blockchain strategy.
At the same time, Binance has approved BUIDL as off-exchange collateral for institutional traders. This allows firms to back their trading positions with tokenized U.S. Treasuries without handing over custody to the exchange. Binance states that this milestone enhances secure and efficient access to digital assets, thereby strengthening confidence in the BNB Chain ecosystem.
BUIDL pays daily dividends and tracks short-term U.S. Treasury yields. It is now the largest tokenized real-world asset on the market. The new BNB Chain share class gives qualified investors faster settlement, lower fees, and simple peer-to-peer transfers—making the fund easier to use across DeFi and institutional platforms.
The firm says the expansion boosts accessibility and turns real-world assets into programmable financial tools that can interact with exchanges, custodians, and decentralized applications.
BNB Price Holds Key Support as Bears Slow Down
BNB is trading near $927 after several days of steady selling, and the price has now reached a key support zone. This area has acted as a strong demand level before, making it important to determine whether the market will stabilize or continue falling. The token is also trading below the 50-day moving average at $1,085, which now acts as the first major resistance.
Meanwhile, the 200-day moving average at $831 remains the main long-term support if the current zone breaks. The recent decline follows a sharp correction from the October high around $1,375, which remains the major resistance level for any meaningful recovery. Until BNB regains strength above the 50-day moving average, the short-term trend will likely remain bearish.
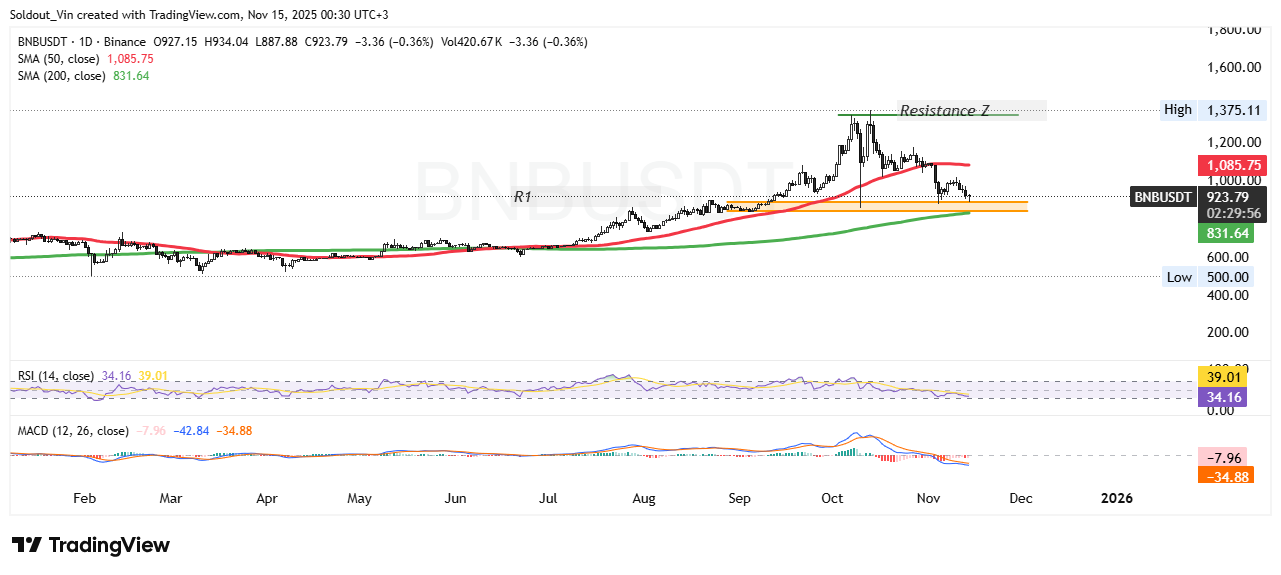
BNBUSDT Analysis Source: Tradingview
Technical indicators continue to show weakness, but with early signs that seller momentum may be slowing. The RSI (14) is at 34, close to the oversold zone, suggesting selling pressure is easing. The MACD remains below the signal line, indicating bearish momentum, but the gap between the two lines is narrowing, which could signal a potential trend reversal if buying volume increases.
If buyers manage to hold the current support zone, BNB could attempt a rebound toward the 50-day SMA at $1,085. A clean break above this level could open the way for a retest of the $1,375 resistance zone. However, if the price breaks below the support and falls under the 200-day SMA at $831, the downtrend may extend further, with potential targets near $700–$600.
For now, traders are watching to see whether BNB can hold support or whether a breakdown will confirm more downside in the coming days.


