BTC Stagnation vs. Ethereum USD Breakout: The CPI Catalyst and the Reverse Squeeze
BTC Stagnation vs ETH Breakout: CPI Catalyst Incoming

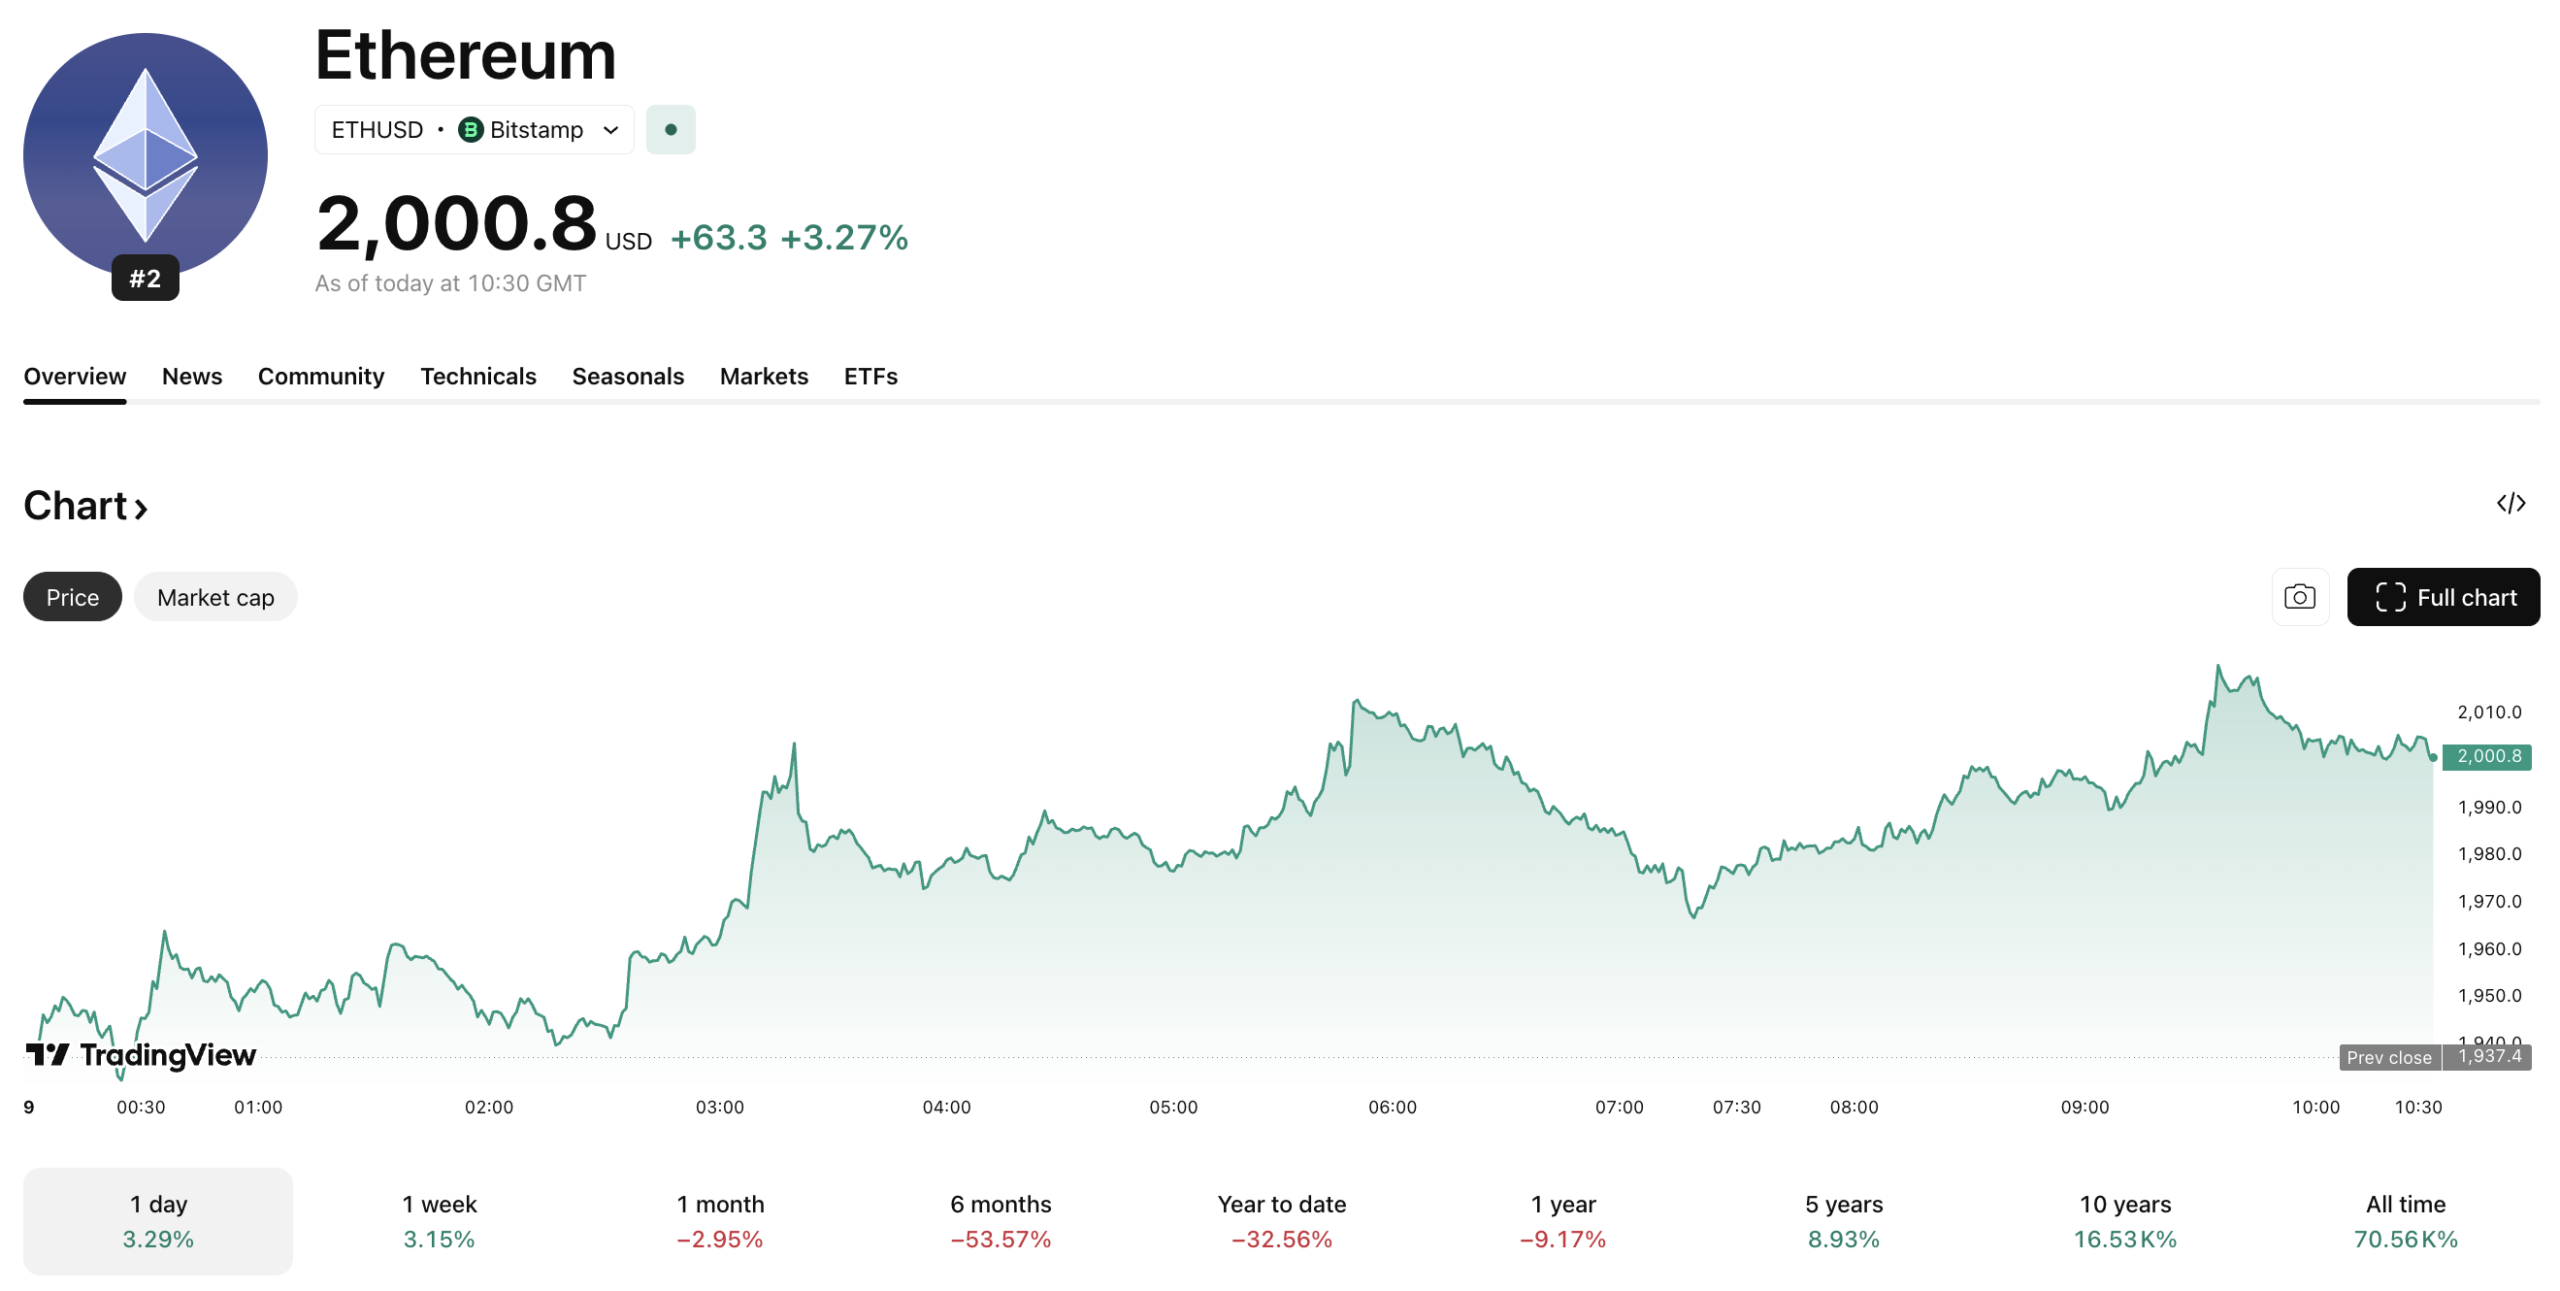
Ethereum USD is flourishing while the Bitcoin price is fighting a precarious battle to hold the $67,000 level, with ongoing tensions between the US and Iran spooking investors away from the markets.
While BTC USD stagnates at this critical structural juncture, Ethereum has suddenly broken away with a crisp +2% move overnight, establishing a stark divergence on the asset charts.
This sudden flash of strength in ETH puts BTC Dominance, currently sitting at 58.90%, under intense scrutiny as traders look for evidence of a sustained trend reversal.
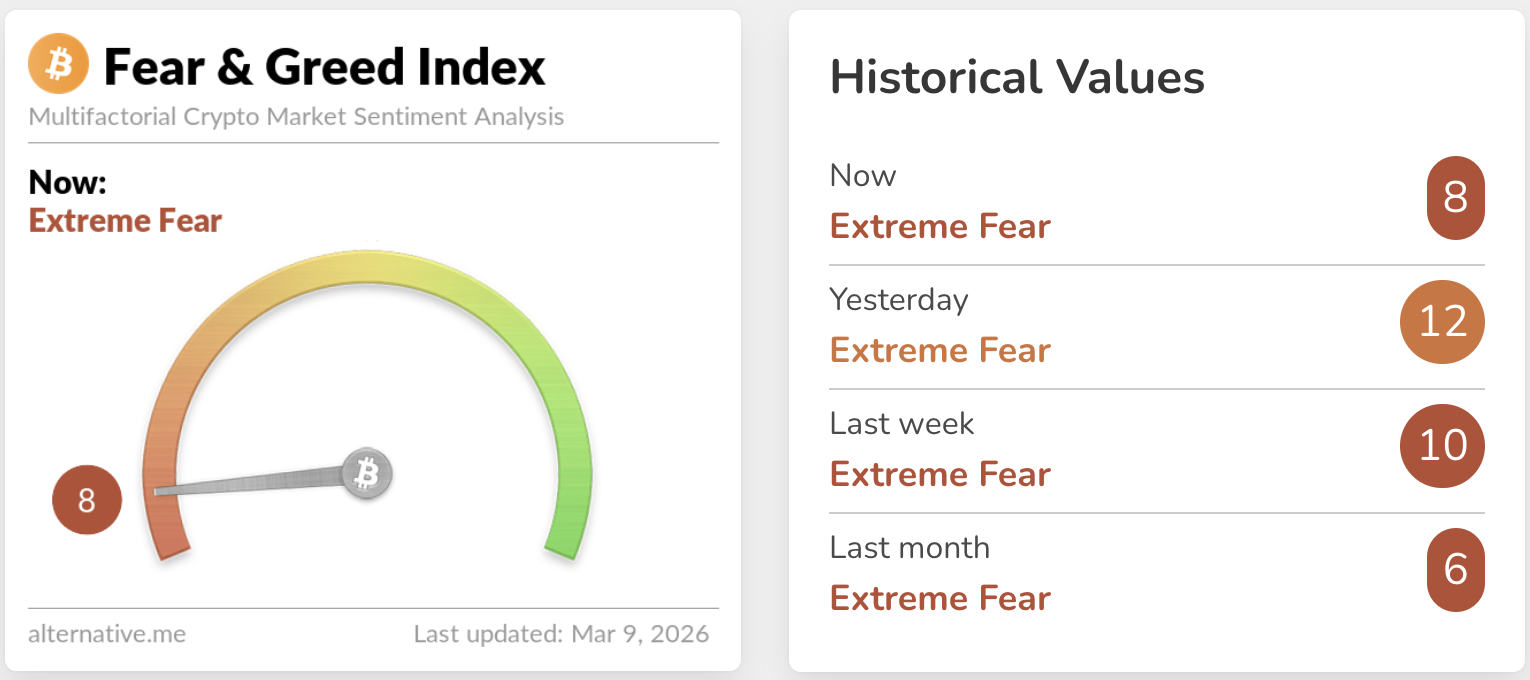
With the Fear & Greed Index flashing a dismal 8/100, the broader market feels like a tightly coiled spring waiting for a fundamental spark. The incoming CPI Data print is shaping up to be exactly that catalyst, threatening to fundamentally rewrite the capital allocation playbook for the rest of 2026.
What ETH’s Breakout Signals: The Ethereum Rotation Has Begun
Is this a temporary, sentiment-driven numismatic premium on ETH, or the start of a much broader structural shift? Ethereum’s +2% while BTC USD dropped -0.2% overnight is a glaring leading indicator of the highly anticipated Ethereum Rotation.
When BTC Dominance stalls at the 58% threshold while the ETH/BTC ratio firmly bounces from its historic multi-year lows, smart money is officially signaling an appetite for higher beta assets.
Prior to this March surge, ETH endured a punishing six-month bearish streak, but the narrative is shifting fast. According to Capital Street FX data, whale cohorts holding 100,000 to 1,000,000 BTC have been quietly accumulating, but the rapid institutional flow into spot ETH momentum trades suggests a changing of the guard.
If Ethereum can sustain its proof-like clarity above local resistance, it confirms that institutional capital is rotating out of the crowded digital gold trade. However, traders should carefully note that the rotation remains unconfirmed until BTC.D decisively breaks below 57.50% on the weekly timeframe.
DISCOVER: Top Crypto Presales to buy in February
The CPI Catalyst: Preparing for the Fundamental Trigger
The entire crypto market is currently paralyzed, waiting for mid-week CPI Data to provide the definitive directional mandate.
As highlighted in our recent analysis of the Bitcoin price volatility ahead of the CPI data drop, this single macroeconomic print will dictate the near-term flow of institutional capital. The consensus estimate hovers around a relatively sticky inflation read, but the real play is in trading the margins.
The bull scenario, a softer-than-expected print, is the path of least resistance for risk-on assets, giving the Federal Reserve room to breathe on rate cuts and likely igniting a proper Altcoin Season as liquidity floods down the risk curve. Conversely, a hot CPI print is the ultimate market pain trade.
In that bear scenario, risk appetite evaporates entirely, BTC dumps deeply below its key structural support, and dominance stays artificially elevated as altcoins face a brutal haircut, leaving late retail buyers holding the bag.
Market Data and Technical Levels to Watch for BTC and Ethereum USD
If you are trading this transition, precise technical execution is non-negotiable. For Bitcoin USD, the precarious $65,500–$66,000 zone must hold as absolute weekly support; a clean break below this floor opens a dangerous trapdoor down to the 200-day EMA near $62,900.
On the upside, BTC bulls need to aggressively reclaim the $69,500 level before attempting to push back toward the $73,648 monthly high seen on March 4.
On the Ethereum USD chart, traders need to see a definitive weekly close above the $2,160–$2,180 neckline. If ETH securely clears that zone, it completely invalidates a multi-month bearish pattern and targets $2,350 next. The big question is: ‘Is ETH USD setting a brutal trap, or signaling a real breakout?’
The answer lies in the ETH/BTC ratio; if it maintains its upward trajectory while BTC.D falls, the technical confirmation is locked in.
EXPLORE: Best Crypto Meme Coins to buy in 2026
Drop CoinNews a Follow on X and Telegram for all of the Latest Crypto Market Updates and Professional Market Analysis.


