Chainlink Price Climbs As Grayscale Launches First LINK ETF With $41M Inflows

The Chainlink price climbed 1.4% in the last 24 hours to trade at $14.64 as of 4:27 a.m. EST on trading volume that slid 10% to $1 billion.
Sentiment was buoyed by news of the launch of the Grayscale Chainlink ETF (exchange-traded fund) on NYSE Arca, the first LINK ETF in the US.
The newly launched Grayscale product trades under the ticker GLNK and attracted nearly $42 million on its first day of trading.
According to Bloomberg ETF analyst James Seyffart, the inflows on day one were a “very good opening for a new launch.”
The debut signals accelerating investor demand for Oracle-driven blockchain infrastructure while opening a streamlined path to Chainlink exposure without direct crypto ownership.
As Chainlink expands its footprint across more blockchains, it broadens the market for its oracles and cross-chain services.
Such exposure could drive demand for LINK tokens, potentially bolstering the Chainlink price.
Chainlink Price Shows Signs Of Recovery
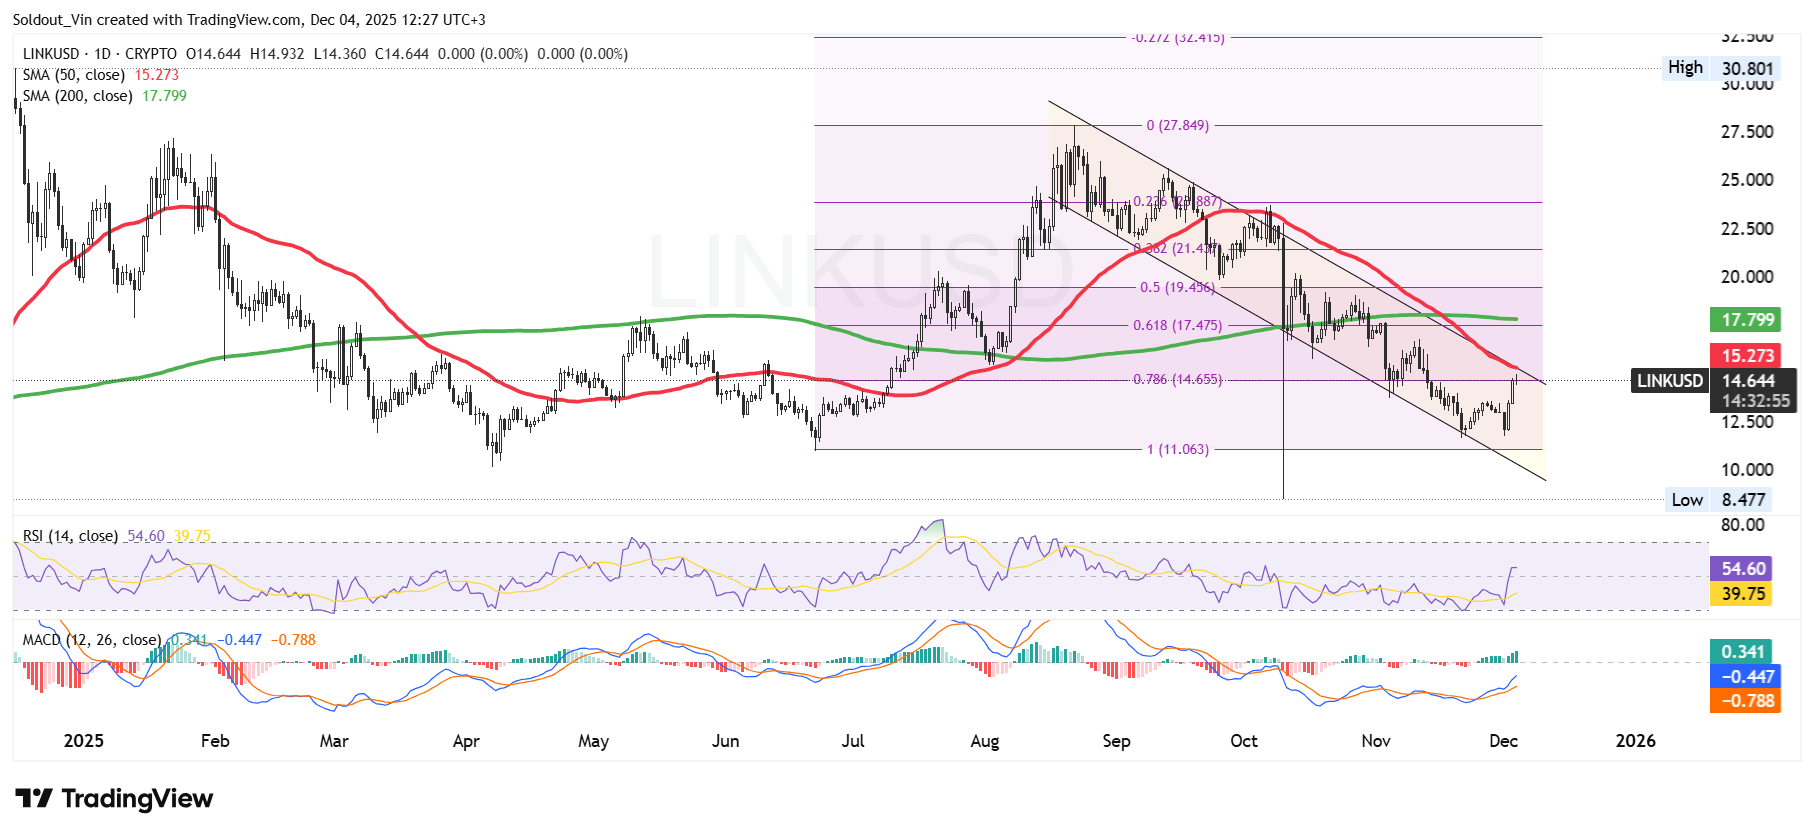
According to the LINK/USD chart analysis on the 1-day timeframe, LINK has been under bearish pressure, but is currently showing signs of a recovery.
After rallying strongly in July–August, the 0.236 Fibonacci retracement level ($21.41) temporarily offered support, enabling the Chainlink price to retest the upper resistance zone around $27.8.
However, LINK was unable to break above this barrier, leading to a significant decline that pushed the price down toward the 0.786 Fibonacci retracement level ($14.65).
Despite buyers’ attempts to reclaim the 0.618 Fib level ($17.47), bears remain dominant, with the price of LINK continuing to trade within a falling channel pattern and failing to recover above key resistance levels.
As a result of the prolonged downtrend, LINK is currently trading below both the 200-day Simple Moving Average (SMA) ($17.79) and the 50-day SMA ($15.27), reinforcing the bearish market outlook.
Meanwhile, the Relative Strength Index (RSI) is currently around 54, recovering from oversold territory, but still showing that momentum is fragile and has not fully shifted toward buyers.
The Moving Average Convergence Divergence (MACD) on the daily chart is showing signs of a recovery, poised to cross above its signal line.
LINK Price Prediction
The LINK price is showing early signs of recovery after bouncing from the lower boundary of the falling channel. With momentum indicators beginning to shift, LINK may be preparing for a short-term bullish attempt.
If buyers continue to support the Chainlink token above the 0.786 Fib level at $14.65, the price could push toward the next resistance area around the 0.618 Fibonacci level at $17.47, which also aligns with the 200-day SMA.
A successful reclaim of this zone at the price would strengthen bullish sentiment and could open the door to a move toward the 0.5 Fib level near $19.43.
Improving momentum indicators support this recovery scenario. Data by Ali Martinez, a popular crypto analyst on X, shows that whales bought 4.3 million LINK in the last 2 days, a bullish indicator.
But if the recovery fails and LINK falls back under the $14.65 support, bears could regain control and push the price back toward the $13–$14 range.


