Ethereum Drops Below $3,000 as Fidelity Selects Network for New Stablecoin

Ethereum price is now more than 14% below its local peak this year near $3,400, underscoring the seller’s tenacity above $3,000. ETH has formed a bearish technical setup, suggesting pressure may persist into February.
ETH fell about 3.1% to trade at $2,942 as of 05:51 a.m. EST after the Federal Reserve held rates steady at its first policy meeting of the year, with rising Iran-related geopolitical tensions adding to the risk-off mood.
The latest drop has put Ether into the breakdown phase of its symmetrical triangle setup, even as Fidelity selects the Ethereum network for a new stablecoin.
Fidelity to Launch Digital Dollar Stablecoin on Ethereum
Fidelity Investments has announced the forthcoming launch of the Fidelity Digital Dollar (FIDD) stablecoin on the Ethereum network, set to debut in late January 226 and backed by US dollar reserves.
The move comes amid increasing regulatory clarity, which could influence the stablecoin market structure while providing new liquidity options for Ethereum and other assets.
The launch is led by Mike O’Reilly, President of Fidelity Digital Assets. The stablecoin is intended to provide investors with on-chain utility and to align with recent regulatory developments, such as the GENIUS Act.
FIDD is designed to enhance liquidity, enable low-cost settlements, and support payments on decentralized finance (DeFi) platforms. It will be available for purchase through Fidelity’s channels and major exchanges.
The GENIUS Act has removed regulatory uncertainty, supporting the development of stablecoins such as FIDD. Furthermore, Fidelity’s position as a leading asset manager aims to advance digital finance through this stablecoin offering.
Ether Price Set For a Sustained Breakdown
The Ethereum price is trading at $2,942.53, down 3.13% in the last session, signaling continued weakness following a failed recovery attempt. The daily chart highlights a critical support zone near $2,850–$2,900 that has recently served as a short-term floor following a rejection at higher resistance levels.
The symmetrical triangle developed after the sharp decline from the $3,900–$4,000 resistance zone, suggesting the market is pausing before its next directional move.
Price action has respected both the ascending support trendline and descending resistance trendline, with buyers stepping in near the $2,850–$2,900 support zone while sellers remain active near the $3,200–$3,300 area.
ETH dropped below the pattern’s lower trendline last week, then rebounded to test that former support as resistance. The retest failed, and the price stayed capped beneath the trendline into this week.
A major resistance zone remains around $3,650–$3,700, just around the 200-day Simple Moving Average (SMA), which continues to cap upside attempts.
Meanwhile, the 50-day SMA near $3,050 is sloping downward and acting as near-term resistance.
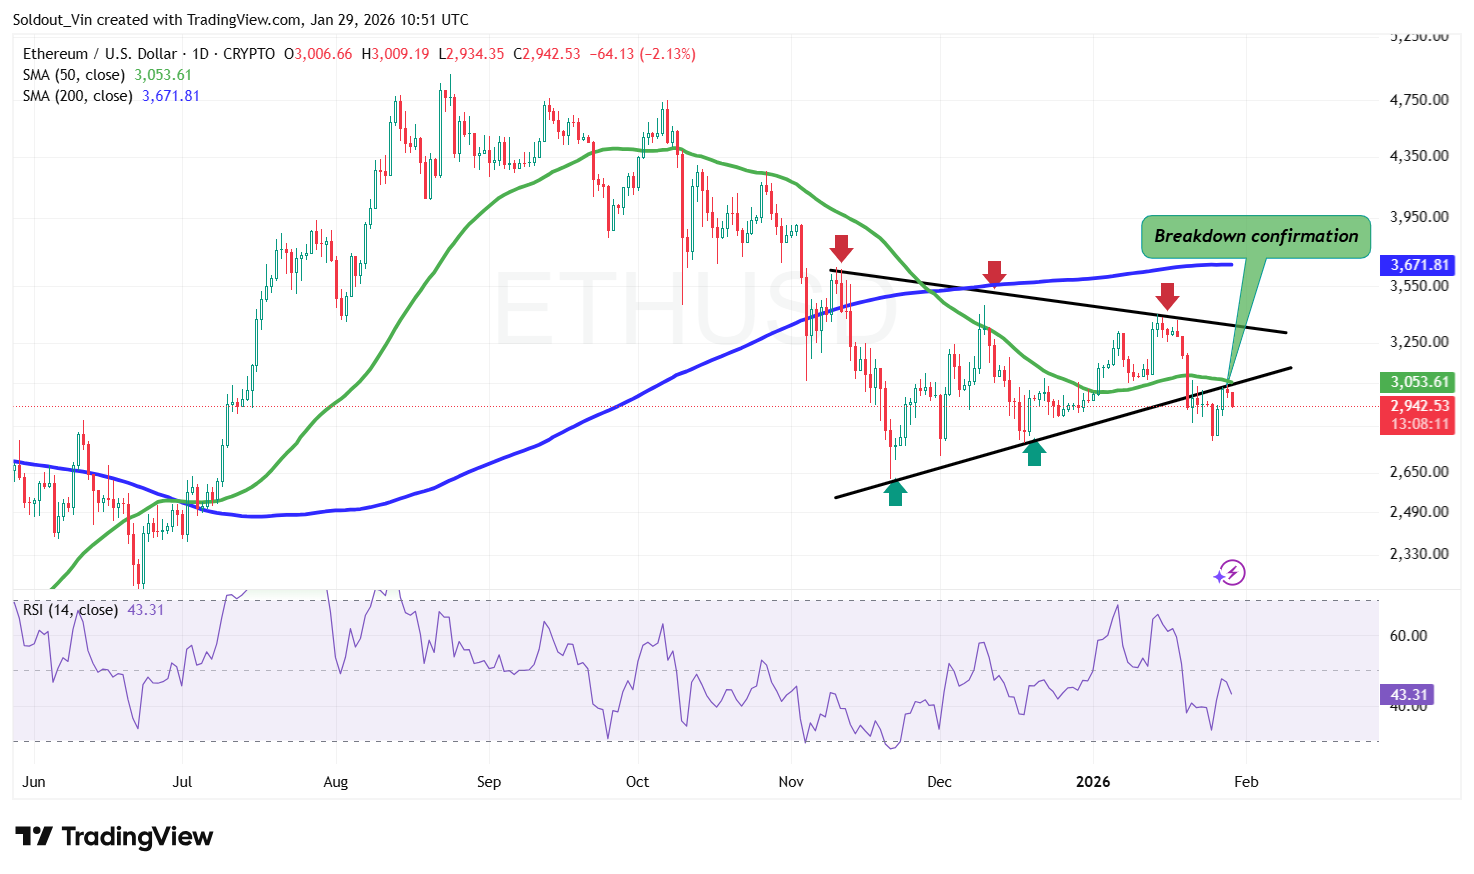
ETH Price at an Important Decision Point
The Relative Strength Index (RSI) is currently around 43.31, signaling mild bearish momentum but not oversold conditions.
Ethereum now sits at a critical point, as symmetrical triangles often precede high-volatility breakouts. Traders are closely monitoring price behavior near the apex of the formation for confirmation. A breakout above the $3,200–$3,300 resistance could open the door for a move toward $3,650 and higher, while sustained strength above the 200-day SMA would shift broader sentiment.
However, the price is now trading slightly below the symmetrical triangle pattern, which puts investors on edge, as a sustained downtrend could mean the bullish outlook is lost. In technical analysis, a break below support followed by a rebound and rejection often signals that sellers have flipped the level into resistance, raising the odds of further downside.
A breakdown below the $2,850 support would invalidate the consolidation and could trigger renewed downside pressure, potentially exposing $2,600–$2,500 as the next support region.


