Ethereum Price Climbs 1% As Tom Lee Stays Bullish And Bitmine Buys Another $44M In ETH

The Ethereum price edged up 1% over the past 24 hours to trade at $3,027 as of 9:59 a.m. EST on trading volume that jumped 26% to $19.5 billion.
This comes after Tom Lee’s BitMine Immersion Technologies added 14,618 ETH worth $44.34 million to its corporate Ethereum treasury on Thursday, according to Lookonchain.
As of its last official announcement, BitMine holds 3,629,701 ETH, worth about $10.9 billion, representing around 3% of the total Ethereum supply. Its hoard puts the company on track to achieve its goal of accumulating 5% of the total supply, underscoring its commitment to supporting Ethereum’s growing role in financial market services.
Ethereum is now down 22% in the last month, despite the latest recovery attempts.
Even so, in a recent podcast interview, Lee predicted that ETH would bottom near $2,500 and then rise toward $7,000 to $9,000 by the end of January 2026.
ETH has now recovered above $3,000 after weeks of downside pressure, sparking hopes of a potential trend reversal.
Ethereum Price Poised For A Bullish Trend Reversal
After surging to a new all-time high (ATH) of $4,954, the ETH price lost momentum and formed a clear rounded top, signaling that bulls have lost control.
Once the rounded top formed, the Ethereum price changed direction, sending the asset trading below both the 50-day and 200-day Simple Moving Averages (SMAs) on the daily timeframe.
The bearish sentiment continued to respect the falling 50-day SMA, confirming that sellers remained firmly in control. The break below the 200-day SMA further reinforced the negative trend, pushing ETH into a deeper retracement.
However, after reaching the critical 0.618 Fibonacci support level around $2,977, ETH is beginning to show early signs of stabilization. This region acted as a key reaction level during previous market swings, making it a major technical support area.
Momentum indicators support this potential stabilization. The Relative Strength Index (RSI) has climbed slightly from recent lows and now sits near 41, suggesting the market remains bearish, but that downside momentum is no longer happening.
Meanwhile, the Moving Average Convergence Divergence (MACD) shows early improvement, with the histogram above the zero line and the blue MACD line crossing above the orange signal line, which is seen as an early sign of a recovery attempt.
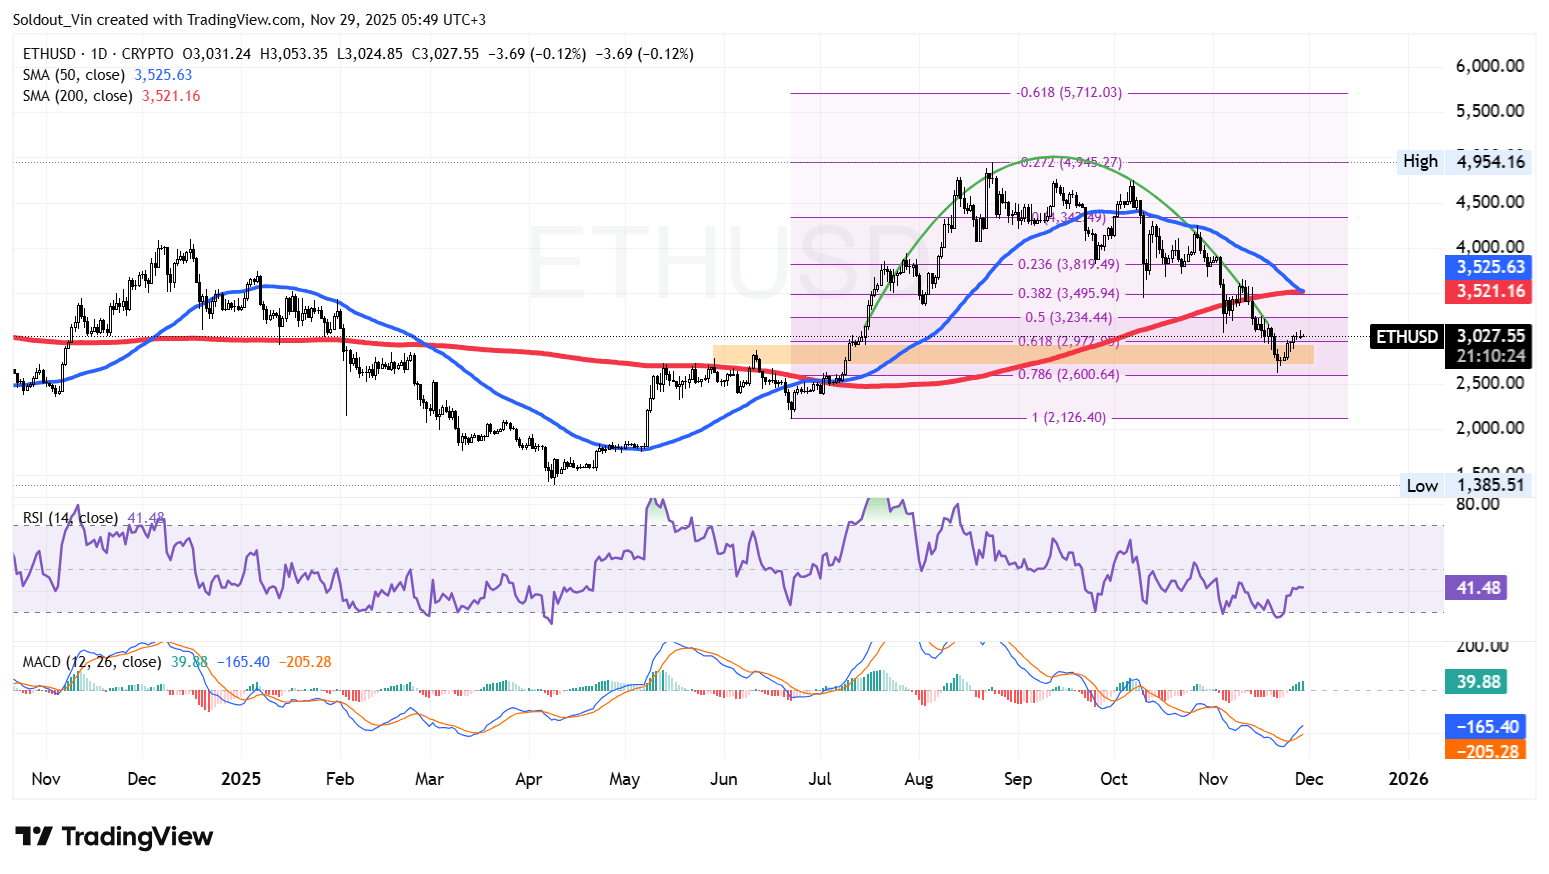
ETH appears to be attempting a short-term bounce from the 0.618 Fibonacci zone.
If buyers successfully defend this region, the Ethereum price may attempt to retest the $3,234–$3,495 resistance band, which aligns with both the 0.50–0.382 Fibonacci retracements and the descending 50-day SMA.
A break above these levels could allow the bulls to push Ethereum’s price toward the next key resistance at $3,819.
Conversely, if bearish pressure resumes, ETH could revisit deeper support around $2,600, which lies at the 0.786 Fibonacci level.


