Ethereum Price Drops 1.5% As 10X Research Says Short ETH To Hedge Bitcoin Longs

The Ethereum price dropped 1.5% over the past 24 hours to trade at $3,846.83 as of 6.04 a.m. EST on trading volume that plunged 4% to $35.7 billion.
This comes as 10X Research recommended hedging bullish Bitcoin positions by shorting ETH, citing weak ETH demand and strong institutional interest in BTC.
Such a strategy aims to capitalize on divergent market sentiment and potential price movements.
According to Markus Thielen, founder of 10X Research, shorting Ether could be a good hedge primarily because the ETH digital asset treasury (DAT) outlook appears relatively weak.
Ether has a notable absence of significant capital inflows, with purchases by entities such as Bitmine Immersion Technologies likely to reduce as its capital-raising potential is now constrained.
“If Bitmine is tapped out, so is Ethereum’s upside, at least for now,” Thielen said.
Conversely, Bitcoin demonstrates robust institutional conviction. Its options open interest has reached a record $50 billion, driven by demand for upside exposure through call options.
Meanwhile, Ethereum ETFs (exchange-traded funds) recorded outflows for a second day, with $184 million leaving the funds yesterday, according to Coinglass data.
Ethereum Price Holds Key Support, Eyeing Potential Rebound Toward $4,200
After strong resistance near $4,950 earlier in the quarter, the ETH price has entered a consolidation phase, holding steady above the crucial $3,800–$3,500 support zone.
This level coincides with major Fibonacci retracement levels and the long-term 200-day Simple Moving Average (SMA), offering a solid foundation for a potential bullish reversal.
Currently, the Ethereum price trades around $3,846, maintaining a range between the 50-day SMA at $4,197 and the 200-day SMA at $3,329. The price of Ethereum action indicates indecision in the market, but buyers continue to defend the lower trend boundary, signaling resilience among bulls.
Meanwhile, the Relative Strength Index (RSI) sits at 42.96, hovering below the neutral 50 mark. This suggests that bearish momentum has slowed, but buyers have yet to regain full control. A push above 50 could confirm renewed bullish strength.
Moreover, the Moving Average Convergence Divergence (MACD) also supports the likelihood of a bullish move, as the blue MACD line nears the orange signal line. This setup indicates a possible momentum shift in favor of the bulls if confirmed in the coming sessions.
The 0.382 Fibonacci level ($3,870) is currently providing support, with additional support at $3,535 (0.5 Fib) and $3,200 (0.618 Fib). As long as ETH remains above $3,500, the broader trend remains bullish in the long term.
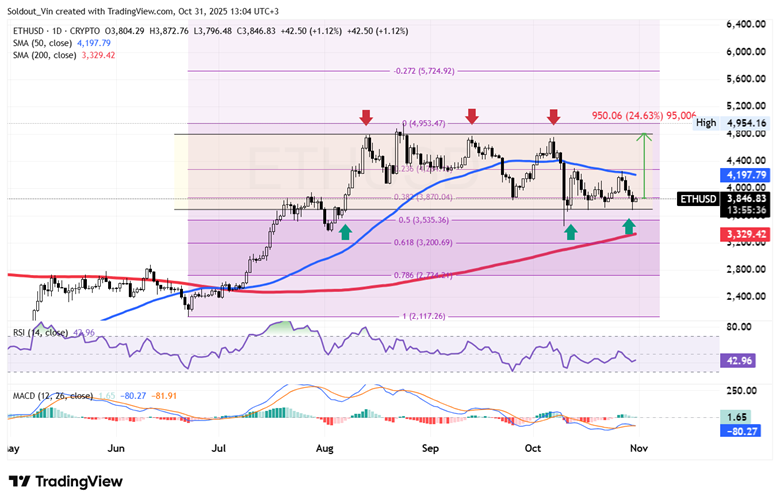
ETH/USD Chart Analysis: TradingView
ETH Targets Rally Towards $4,950
According to the ETH/USD technical analysis, the Ethereum price appears to be forming a base for a possible rebound from the $3,800 region. The confluence of Fibonacci supports, the 200-day SMA, and stabilizing momentum indicators supports the view of a potential bullish recovery.
If the price of ETH sustains above $3,535 and reclaims the 50-day SMA ($4,197), the next upside target could be $4,950, followed by $5,700 in extension.
Conversely, a daily close below $3,200 would invalidate the bullish thesis and expose ETH to deeper corrections toward $2,700 (Fib 0.786).