Ethereum Price Hints At Rebound As Blackrock Plans For Another Staked Ethereum ETF

The Ethereum price has slumped 3% in the last 24 hours to trade at $3,049 on a 9% increase in trading volume to $41 billion.
The drop in the ETH price happens after BlackRock hints at launching a new staked Ethereum ETF by registering the product name in Delaware, signalling plans to expand beyond its existing iShares Ethereum Trust (ETHA). Although this registration is only the first stage, BlackRock must still file additional documents before the ETF can proceed.
ETHA has already attracted $13.1 billion in inflows since July 2024, though it currently does not include staking due to regulatory and operational challenges. The new proposal aligns with broader industry momentum, as issuers push for staking integration and the SEC—under the Trump administration—has streamlined crypto ETF approvals with generic listing standards.
Staked ETH ETFs are gaining traction, with REX-Osprey and Grayscale launching similar products recently. These funds can offer additional yield, with ETH staking averaging 3.95% annually, making them more appealing to income-focused investors. Despite rising interest in altcoin ETFs, BlackRock remains focused on Bitcoin and Ethereum.
Ethereum Forms Bullish Falling Wedge as Price Tests Key Rebound Zone
Ethereum (ETH) is trading around $3,047 while forming a clear falling wedge pattern on the daily chart. This pattern is typically bullish, and ETH is now moving inside the potential rebound zone, where buyers often step in. If this support holds, the price could attempt a breakout soon.
ETH is still below the 50-day simple moving average (SMA) at $3,799, which serves as the first resistance. The 200-day SMA at $3,491 is another key barrier in the reward zone. A move above both SMAs would signal a stronger recovery and shift the short-term trend back to bullish.
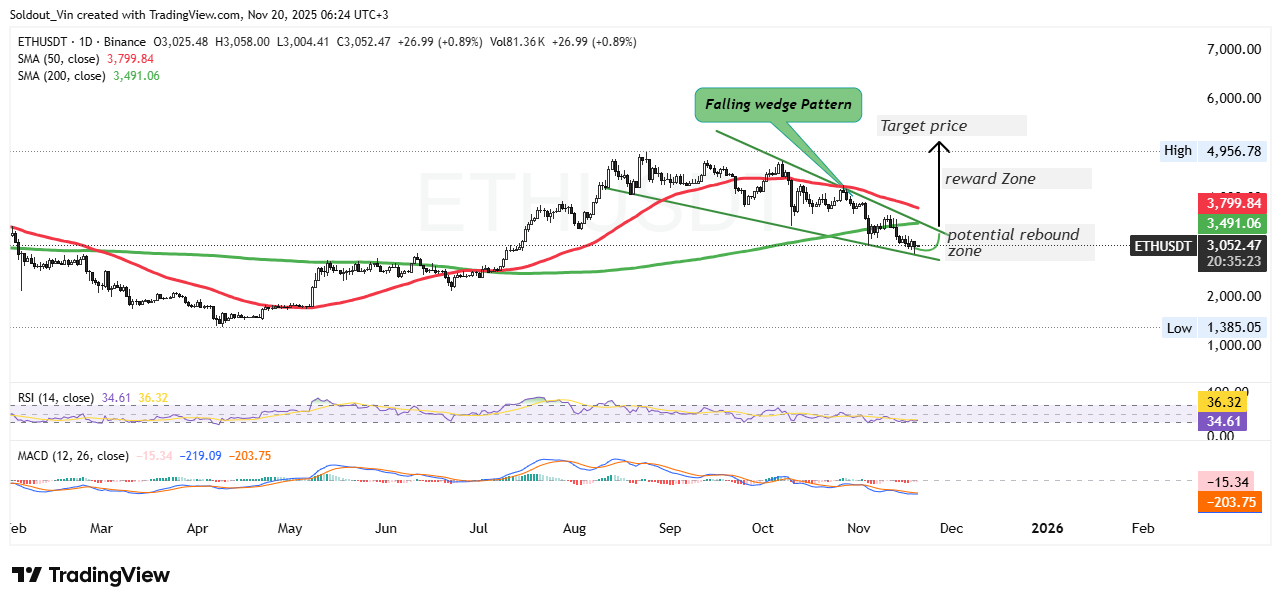
ETH/SUDT Daily Chart Analysis. Source: Tradingview
The RSI is at 34, showing ETH is in the oversold area. This usually suggests the market may be close to a rebound. If the RSI climbs above 40, it would confirm that buying pressure is returning. The MACD remains bearish, but the histogram bars are getting smaller, meaning the selling momentum is weakening. A bullish MACD crossover from this level would support a reversal.
If ETH breaks out of the falling wedge, the next target sits around the $4,100–$4,200 zone, which matches previous highs and the resistance area shown on the chart. A successful move above this zone could push the price toward the higher target near $4,956.
However, if ETH loses the rebound zone, the next major support is around $2,800. A break below that level would invalidate the bullish pattern and could lead to more downside.
The falling wedge pattern, oversold RSI, and weakening bearish momentum all point to a possible upward move, but the price must hold current support and break above the SMAs to confirm a trend reversal.


