Ethereum Price Jumps 5% as Tom Lee Predicts Crash Will End This Week

The Ethereum price has surged 5% in the last 24 hours to trade at $3,109 on a 36% plunge in trading volume to $37 billion.
This ETH price jump comes as Tom Lee, the founder of FundStrat and Chairman of BitMine, says the ongoing Ethereum crash could be a strong buying opportunity and predicts the downturn will end this week. Lee argues that Ethereum is superior to most cryptocurrencies because it powers the fast-growing tokenization industry.

He notes that major Wall Street firms, such as BlackRock, Franklin Templeton, and Janus Henderson, are already utilizing Ethereum to launch tokenized funds. The network now leads the real-world asset sector with a 63% market share and over $11 billion in tokenized assets.
Lee also believes Ethereum is close to bottoming, saying ETH tends to hit its low when its price-to-TVL ratio nears 50%, a level it is approaching now. He points to the weak ETH/BTC ratio as another sign.
For long-term targets, Lee sees ETH rising to $12,000, $22,000, or even $62,000 if it becomes a global payment network.
Ethereum Price Analysis: Falling Wedge Shows Possible Rebound Ahead
Ethereum is trading around $3,075 after a small daily drop, but the chart shows a bullish falling wedge pattern that could signal a possible trend reversal soon. This pattern forms when the price makes lower highs and lower lows, but the decline slows down over time. As long as ETH stays above the lower wedge support, buyers still have a chance to push the price higher.
The chart marks a “potential rebound zone” just below the current price. This area has been held several times in recent weeks, making it a strong support level. If buyers step in again, ETH could break above the wedge’s upper trendline and start a fresh move upward.
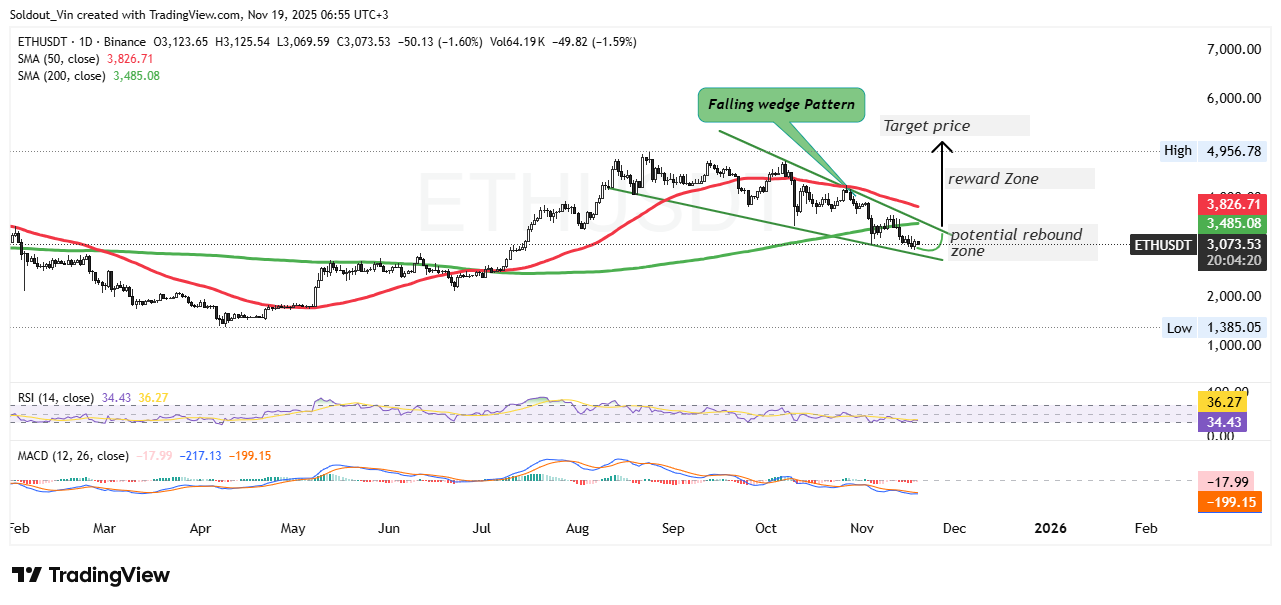
ETH/USDT Daily Chart Analysis. Source: Tradingview
If that breakout happens, the first major target is the reward zone between $3,800 and $4,000, where the 50-day moving average sits. This level has been acting as resistance, so breaking above it would show increasing bullish strength. The next large target shown on the chart is near $4,950, close to the yearly high and also the expected falling wedge breakout target.
Technical indicators also support a possible bounce. The RSI is at 34, near the oversold region, which often signals that sellers are weakening. If RSI moves above 40, it would show early buying strength. The MACD is still bearish, but the histogram is flattening, meaning downward momentum is slowing. A MACD bullish crossover would confirm recovery momentum.
If ETH fails to hold the wedge support, it could fall to the next support around $2,800. But for now, the falling wedge pattern suggests ETH may soon attempt a rebound and move toward the $3,800–$4,000 zone.


