Ethereum Price Jumps as Stablecoin Transfers Hit $8 Trillion

The Ethereum price has surged 2% in the last 24 hours to trade at $3183 on a 28% drop in the daily trading volume to $13 billion.
That came after Ethereum’s record-breaking quarter in late 2025, with Stablecoin transfers on the network passing $8 trillion in Q4, according to Token Terminal. That is almost double the amount moved in Q2, showing very fast growth.
The total amount of stablecoins issued on Ethereum also increased a lot in 2025. Supply grew by 43%, rising from $127 billion to $181 billion by the end of the year. Analysts say this growth is driven by real payments, not speculation. People are already using Ethereum to move money globally.
Ethereum network activity also hit new highs. Daily transactions reached 2.23 million in late December, which is 48% higher than last year. At the same time, monthly active addresses hit a record 10.4 million, meaning more people and businesses are using the network.
Ethereum Leads Stablecoin and RWA Adoption
Daily active users also increased. Over 1 million unique addresses were sending or receiving funds each day by late December.
Ethereum remains the top blockchain for stablecoins and real-world assets (RWAs). It handles about 57% of all stablecoins in circulation. Tron comes second with 27%.
For real-world assets like tokenized bonds and funds, Ethereum controls about 65% of the total on-chain value, or around $19 billion. When Ethereum’s layer-2 networks are included, its share rises to over 70%.
Tether (USDT) is still the largest stablecoin, with $187 billion in supply, and more than half of it runs on Ethereum.
Ethereum Price Signals Strong Bullish Momentum
ETHUSD trading pair is in a strong uptrend on the 4-hour chart. The price is trading near $3,180, and buyers are clearly in control.
The chart shows a parabolic curve, which means buying pressure is increasing as price moves higher. This usually happens during strong rallies. As long as Ethereum stays above this curve, the trend remains bullish.
There is a clear support area around $3,000–$3,050. Each time price dropped into this zone, buyers stepped in quickly. This tells us that traders see this level as a good place to buy, making it an important support to watch.
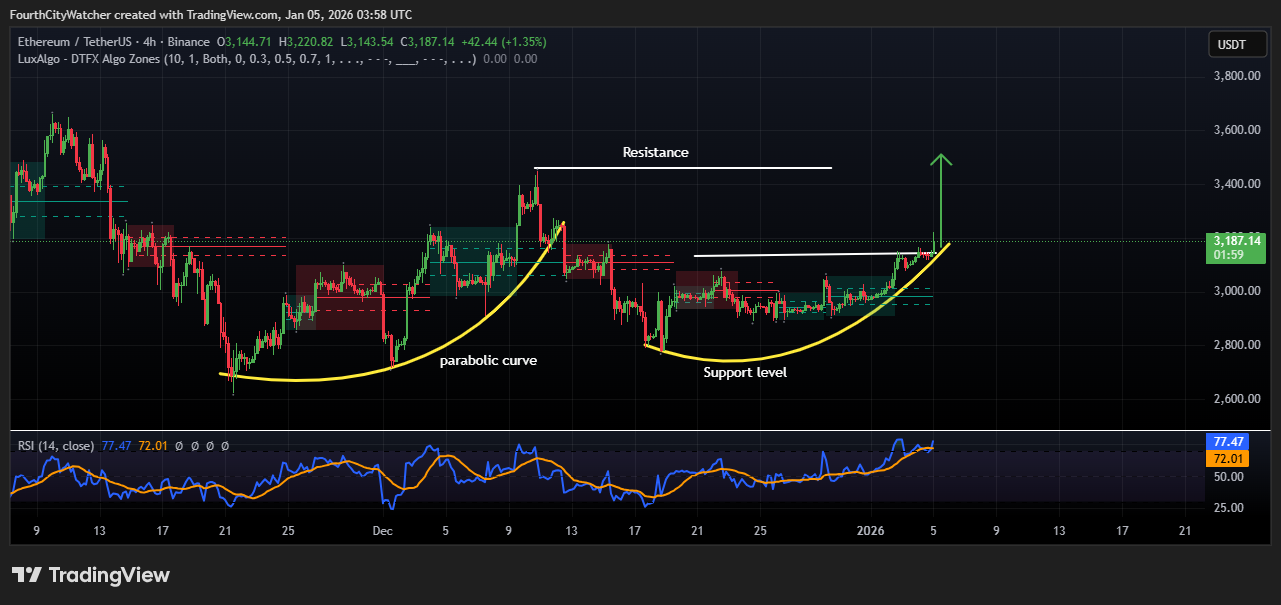
ETHUSDT Analysis Source: Tradingview
On the upside, Ethereum is moving toward a key resistance level near $3,350–$3,400. This area previously stopped price from going higher. If ETH breaks above this level and holds, it could trigger a strong move toward $3,600 or higher, as shown by the upward arrow on the chart.
Ethereum Bulls in Control as RSI Stays Elevated
The RSI indicator is currently around 77, which is considered overbought. This means Ethereum has moved up very fast in a short time. While this shows strong momentum, it also indicates there could be a short pause, pullback, or sideways movement before the next push higher.
Despite the high RSI, the overall structure is still positive. The chart shows higher highs and higher lows, which is a classic sign of an uptrend.
Ethereum looks bullish, but traders should be careful of short-term pullbacks. As long as the price stays above the $3,000 support level, the trend remains strong. A confirmed breakout above resistance would likely attract more buyers and push the price higher.


