Ethereum Price Prediction As Tom Lee’s Bitmine Buys Another $46M in ETH

The Ethereum price tumbled 5% over the past 24 hours to trade at $3,094 as of 2:29 a.m. EST on trading volume that plunged 7% to $23 billion.
This comes even after Tom Lee’s crypto-focused firm Bitmine made another decisive move in the Ethereum market. Bitmine recently acquired 14,959 ETH worth nearly $46 million, reinforcing its long-term conviction.
The firm now has holdings worth beyond 3.86 million ETH, which makes it one of the largest known corporate holders of Ethereum.
Meanwhile, the firm’s average entry price now stands near $3,008 per ETH, which signals disciplined accumulation rather than speculative buying.
BitMine continues to reiterate its goal of accumulating 5% of the total Ethereum supply and its commitment to Ethereum’s growing role in the financial market. It already holds more than 3% of the ETH supply.
Can the price of Ethereum recover from the current downtrend?
Ethereum Price Consolidates Below Key Averages, Eyes Stabilization
After dropping from the yearly high near $4,954, the ETH price found support just above the $3,000 region, where buyers stepped in to slow the downside momentum.
Ethereum is currently trading around $3,090 on the daily chart, attempting to stabilize after the recent corrective move.
Following the rejection from the highs, the Ethereum price decisively moved below both the 50-day and 200-day Simple Moving Averages (SMAs), which confirms a broader bearish market phase.
Despite the bearish pressure, the price of ETH has so far respected the 0.618 Fibonacci retracement level near $3,205, which has become a key technical area. ETH price action remains compressed between the 0.618 and 0.786 Fibonacci retracement levels, located at approximately $3,205 and $2,730, respectively.
This places Ethereum in a tight consolidation range, where bulls and bears seem to be in a contentious tug-of-war.
ETH is currently trading below the 50-day SMA ($3,286) and the 200-day SMA ($3,559), with both SMAs cementing the overall bearish trend.
Meanwhile, the Relative Strength Index (RSI) is at the 47 zone, signaling neutral conditions and a lack of strong directional conviction. This suggests that neither buyers nor sellers have established clear dominance at this stage.
Additionally, the Moving Average Convergence Divergence (MACD) indicator shows early signs of stable momentum picking up. While the MACD remains below the zero line, the histogram has turned positive, and the MACD line is curling upward, indicating a potential early recovery phase if buying pressure increases.
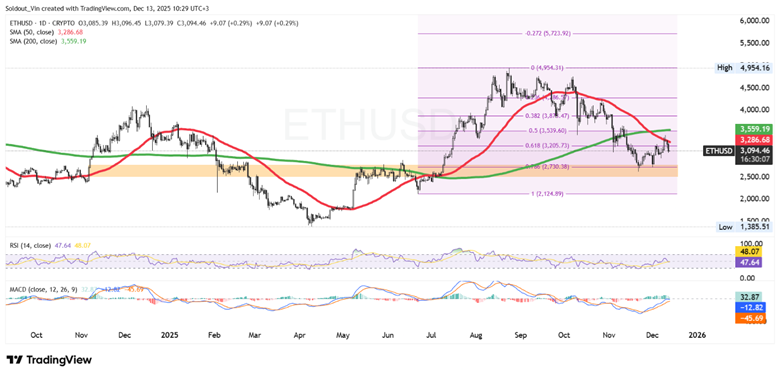
ETH/USD Chart Analysis: TradingView
ETH Price Prediction
Based on the 1-day chart, the ETH price appears to be forming a base within the 0.786–0.618 Fibonacci retracement zone.
If the price of ETH can maintain support above the $3,050 region and break decisively above the $3,205 resistance, followed by a successful reclaim of the 50-day and 200-day SMAs, a recovery toward the mid-Fibonacci resistance zone around $3,540–$3,870 becomes possible.
Conversely, failure to reclaim the SMAs and a breakdown below the $2,730 (0.786 Fib) support could reintroduce bearish momentum, increasing the likelihood of a deeper pullback toward the $2,124 Fibonacci base level.


