Ethereum Rises 2% as ETH Transaction Fees Hit an 8-Year Low

Ethereum’s price is stuck slightly below $3,000, within a choppy range between roughly $2,777 and $3,000, which has capped its price.
ETH is up a fraction of a percentage in the last 24 hours, trading at $2,905 as of 04:58 a.m. EST, as Ethereum transaction fees hit an 8-year low.
The Ethereum token’s slight surge is in line with the broader crypto market, which rose slightly to $2.97 trillion in market capitalization, according to CoinMarketCap data.
However, the average crypto Relative Strength Index (RSI) has recovered from the previous day’s level to 44.76, which shows that buying may be picking up in the market.
Ethereum Transaction Fees Hit An 8-Year Low
After years of high fees, Ethereum is turning the corner, taking on competing platforms like Solana, which is attractive because it is very cheap to transact on the mainnet, and near-zero to move value or implement smart contracts on its layer-2s like Arbitrum or sidechains like Polygon.
In the third week of January, Ethereum is processing more daily transactions than ever before. What’s more? Gas fees are at their lowest levels on record.
Ethereum transaction fees have fallen to their lowest levels since May 2017, even as network activity reaches record highs.
On January 16, daily transactions surged to nearly 2.9 million, underscoring the broader network usage. The decline in fees follows major scalability upgrades, including the Fusaka hard fork in December 2025, which tripled the block gas limit.
With gas prices now approaching zero, simple transfers cost less than $0.0002, making Ethereum significantly cheaper to use and strengthening its case for broader adoption.
Can this be a catalyst to drive interest in the Ethereum token?
Ethereum Price Faces Renewed Selling Pressure
The Ethereum price has struggled to sustain recent recovery attempts, sliding back toward the lower end of its multi-week range after failing to build momentum above key resistance levels.
From a technical standpoint, Ethereum remains entrenched in a bearish corrective phase. Recent upside attempts stalled below the mid-range Fibonacci levels, reinforcing the presence of active sellers on rallies rather than signs of trend reversal.
Ethereum is trading below the 50-day Simple Moving Average (SMA) near $3,065, a level that previously offered short-term support but has now flipped to resistance. The downward slope of the 50-day SMA also further shows weakening short-term momentum.
The longer-term 200-day SMA around $3,670 remains significantly higher and continues to cap any recovery attempts. This level also aligns with a broader supply zone, strengthening its role as a major technical barrier for ETH.
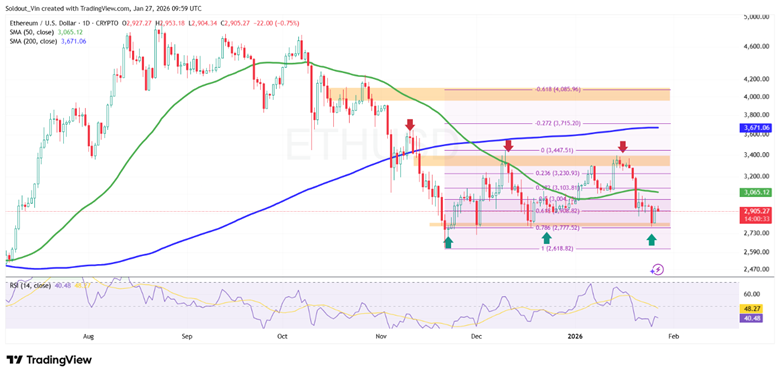
ETH/USD Chart Analysis: TradingView
ETH price remains range-bound, trading between approximately $2,750 and $3,450, a consolidation that has persisted since late November. Multiple rejections near the upper boundary of this range suggest sellers remain firmly in control.
Momentum indicators support this cautious outlook. The RSI is hovering near 40, signaling weak buying strength and bearish momentum, though it has not yet reached oversold territory. This suggests downside pressure can persist without immediate exhaustion.
If Ethereum fails to hold above the $2,750 support zone, a deeper move toward the $2,650 demand area becomes possible. A sustained drop below this level could then expose the lower boundary of the broader structure.


