


FTX Token Price Prediction: FTT Skyrockets 18% After Sam Bankman-Fried X Account Tweets ‘gm’

The FTT price soared 18% in the last 24 hours to trade at $0.9776 as of 4:51 a.m. EST on trading volume that surged 707% to $82.9 million.
This comes after Sam Bankman-Fried’s X account suddenly came back to life, posting ‘gm,’ a greeting that’s short for good morning.
The SBF post was enough to spark heavy speculation, even though a friend later clarified that he’d posted the tweet on Bankman-Fried’s behalf.
SBF, founder and former CEO of the bankrupt FTX crypto exchange, is serving a 25-year federal sentence after being convicted on seven counts of fraud and conspiracy after the exchange collapsed, resulting in billions of dollars in losses for customers.
He was found guilty of money laundering and wire fraud, among other charges.
After the tweet, FTT recovered from a low of $0.78 to soar above the $1 level, touching $1.28 before correcting to the current price.
FTT Breaks Out Of Falling Wedge But Faces Resistance
The FTT price on the daily chart reveals a clear shift in momentum after months of consolidation.
The FTX token price action had been trading within a falling wedge pattern, often signalling a bullish reversal.
Recently, FTT managed to break out of this wedge with a strong upward spike, briefly pushing above $1.20 before pulling back to the $0.97 region.
Despite the rejection, the breakout confirms a change in trend dynamics, suggesting the token is attempting to reverse its prolonged downtrend.
FTT has reclaimed the 50-day Simple Moving Average (SMA) at $0.8753 and is currently testing the 200-day SMA near $0.9728.
The fact that the price of FTT is hovering just around the 200-day SMA indicates a crucial battleground. A sustained close above this level would add strength to the bullish case, while failure to hold it could bring renewed selling pressure.
Looking at major indicators, the Relative Strength Index (RSI) is sitting at 55.71, placing it in neutral territory but leaning bullish since it is above the midline.
This suggests that momentum has shifted toward buyers, though it is not yet in overbought territory.
Meanwhile, the Moving Average Convergence Divergence (MACD) shows a bullish crossover, with the blue MACD line above the orange signal line, reflecting growing bullish momentum.
However, the histogram indicates that momentum may be slowing slightly after the sharp surge.
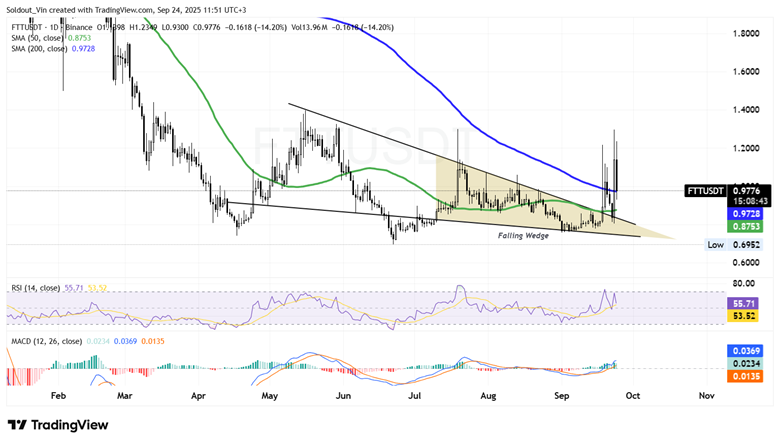
FTT/USD Chart Analysis: TradingView
Based on the current setup, the breakout from the falling wedge gives FTT a bullish bias in the short term, with the next resistance target around $1.20 and then $1.40 if momentum strengthens.
On the downside, strong support lies near $0.87 at the 50-day SMA, with deeper support around $0.70 if the breakout fails.
About Author

About Author




