Hyperliquid Price Prediction: HYPE Plunges 6% After HIP-3 Growth Mode Unveiled

The Hyperliquid price plunged 6% in the last 24 hours to trade at $38.23 as of 4:16 a.m. EST on trading volume that dropped 17% to $512 million.
That HYPE price drop comes as Hyperliquid, the leading on-chain decentralized exchange, launched its HIP-3 growth mode, which allows permissionless market deployment with significantly reduced fees to enhance liquidity.
The new feature will allow anyone to deploy new markets permissionlessly at low fees in a bid to boost liquidity and incentivize new market makers.
HIP-3 growth mode will slash all-in taker fees by over 90% for newly launched markets, and can be activated on a per-asset basis by deployers.
Moreover, the upgrade will lower barriers to entry and trading costs with an aim to deepen liquidity and broaden asset offerings on Hyperliquid. Therefore, this strengthens the protocol’s position as a competitor to centralized avenues.
HYPE Price Compresses Toward Apex As Symmetrical Triangle Tightens
The HYPE price continues to experience consolidation after a corrective phase that began in early October, following its sharp rejection from the $59.45 high.
After slipping below short-term moving averages, the Hyperliquid price recently rebounded from the rising lower boundary of a symmetrical triangle, near the $37–$38 support region. This reaction highlights that buyers are still defending the long-term trendline and the area around the 200-day Simple Moving Average (SMA).
Currently, HYPE trades near $38.23, positioned below both the 50-day SMA at $41.53 and the 200-day SMA at $40.85. The 50-day SMA is trending under the price of Hyperliquid, while the token remains below both SMAs, indicating ongoing short-term bearish pressure.
On the daily chart, HYPE remains confined within the symmetrical triangle, a neutral pattern that often precedes a decisive breakout. With the triangle now approaching its apex, a significant move is likely on the horizon.
The region around $38–$39, where the price of HYPE is consolidating, serves as the first key inflection zone.
A sustained breakout above $42, clearing the 50-day SMA and the descending triangle boundary, could pave the way toward the previous reaction levels around $46–$48, followed by stronger resistance near the psychological $52 zone.
Meanwhile, the Relative Strength Index (RSI) is at 43.88, signaling neutral-to-weak momentum. This suggests that HYPE is neither overbought nor oversold, aligning with the idea of ongoing consolidation ahead of a larger move.
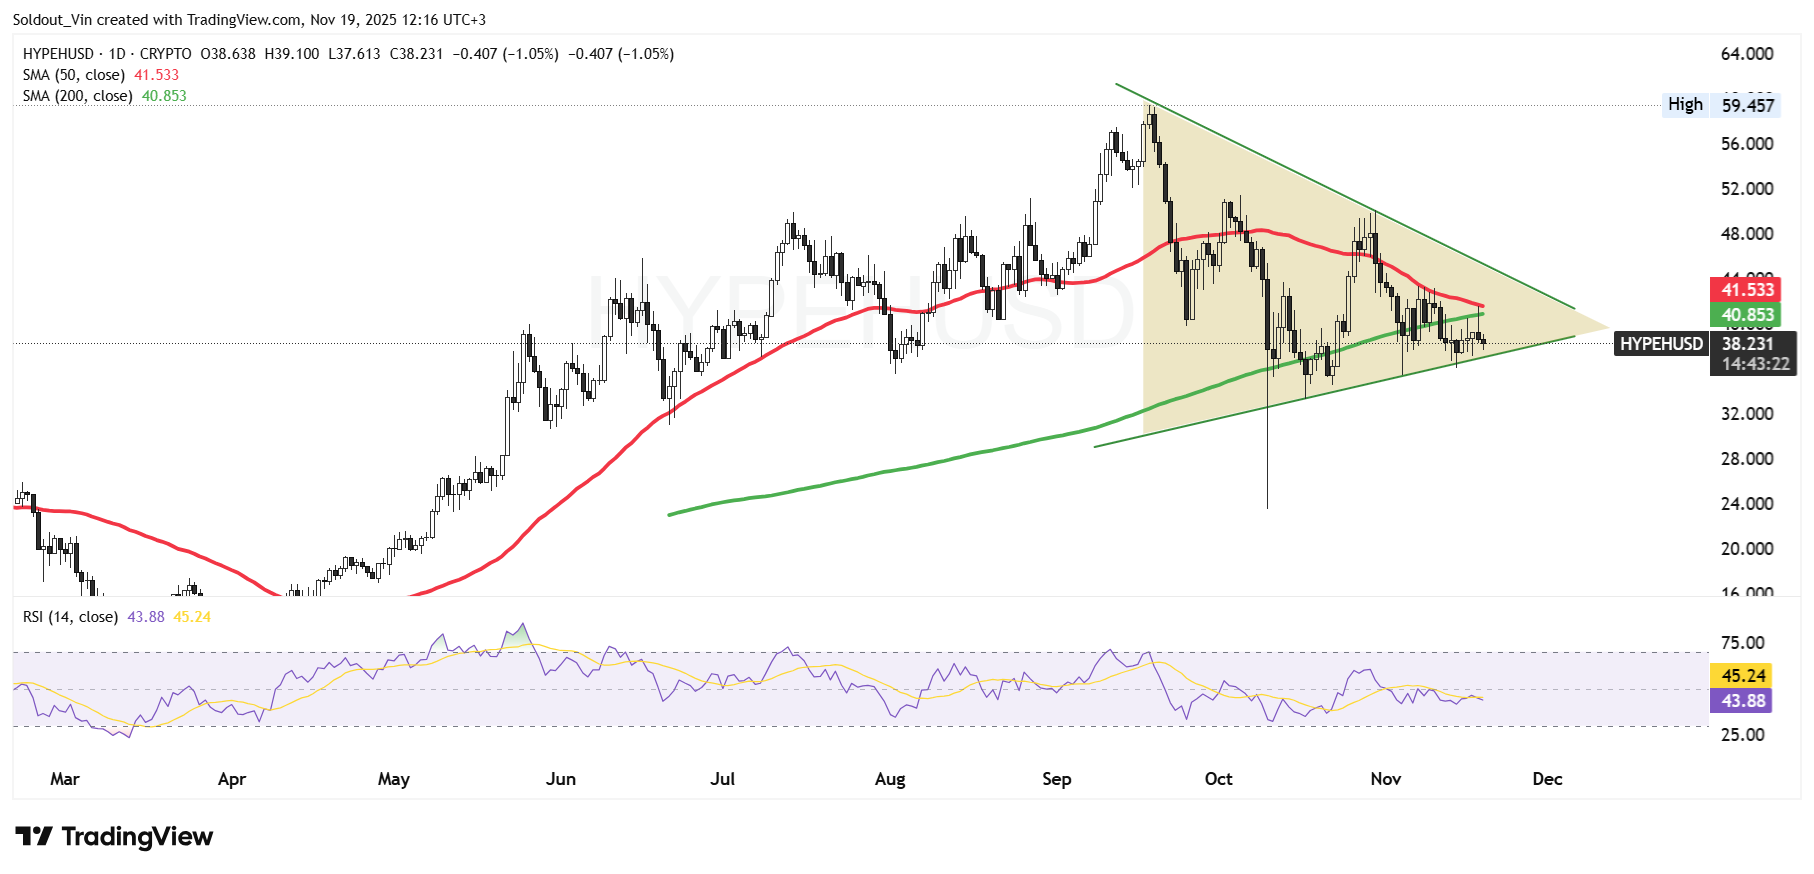
For now, HYPE’s short-term outlook remains cautious. A daily close above $42 may spark a bullish breakout toward $52.
Conversely, failure to hold the $38 support zone could open the door for a deeper pullback toward $34, or even a retest of the $32 demand area if bearish momentum intensifies.


