


Hyperliquid Price Prediction: HYPE Up 13% As Founder Slams Binance, CEXs For Underreporting

The Hyperliquid price is up 13% in the last 24 hours, trading at $41.90 as of 6:12 a.m. EST, with trading volume rising 2% to $817 million.
That comes as Hyperliquid founder Jeff Yan came forward to defend his decentralized exchange (DEX), following accusations of liquidations following Friday’s market crash.
According to Yan, the DEX’s fully on-chain liquidations cannot be compared with Binance and other CEXs (centralized exchanges), which have been underreporting by nearly 100X.
After the crash on Friday, top crypto exchanges like Binance, Coinbase, and Kraken faced congestion, leading to massive liquidations. However, Hyperliquid reported zero downtime while handling all trades swiftly.
Moreover, Yen emphasized that the DEX’s fully on-chain liquidations model offers transparency unmatched by CEXs.
Hyperliquid reports every order, trade, and liquidation, recorded directly on-chain. This allows anyone to independently verify all transactions and assess the platform’s solvency in real time.
“Transparency and neutrality are key reasons that fully on-chain DeFi is the ideal infrastructure for global finance,” stated Yen.
Hyperliquid Price Analysis: Head-And-Shoulders Reversal Signals Weakness But HYPE Finds Support
The HYPE price on the daily timeframe shows a clear head-and-shoulders pattern, a classic bearish reversal structure.
This formation began forming in mid-September, with the left shoulder forming near the $48 level, a peak around $59 marking the head, and the right shoulder capping below $52.
Once the price of Hyperliquid broke beneath the neckline, it confirmed the bearish reversal, resulting in a steep decline that found temporary support at the 200-day Simple Moving Average (SMA) around $36.31.
However, despite this bearish breakdown, the HYPE price has since rebounded slightly, recovering above $41.90 at the time of the chart. The Fibonacci retracement levels plotted from the prior swing low to the recent high show that the price briefly tested the 0.786 level near $40.61, which coincides almost perfectly with the 200-day SMA, a historically strong support area.
This confluence suggests the selling pressure may have cooled temporarily, allowing for a short-term technical bounce.
Meanwhile, the 50-day SMA, currently sitting near $47.88, slopes slightly downward, indicating that short-term momentum remains bearish.
Furthermore, the Relative Strength Index (RSI) at 43.33 lies in neutral territory but closer to the oversold threshold of 30. This reading suggests that while the recent selloff brought some exhaustion among sellers, momentum for a strong bullish reversal has not yet developed.
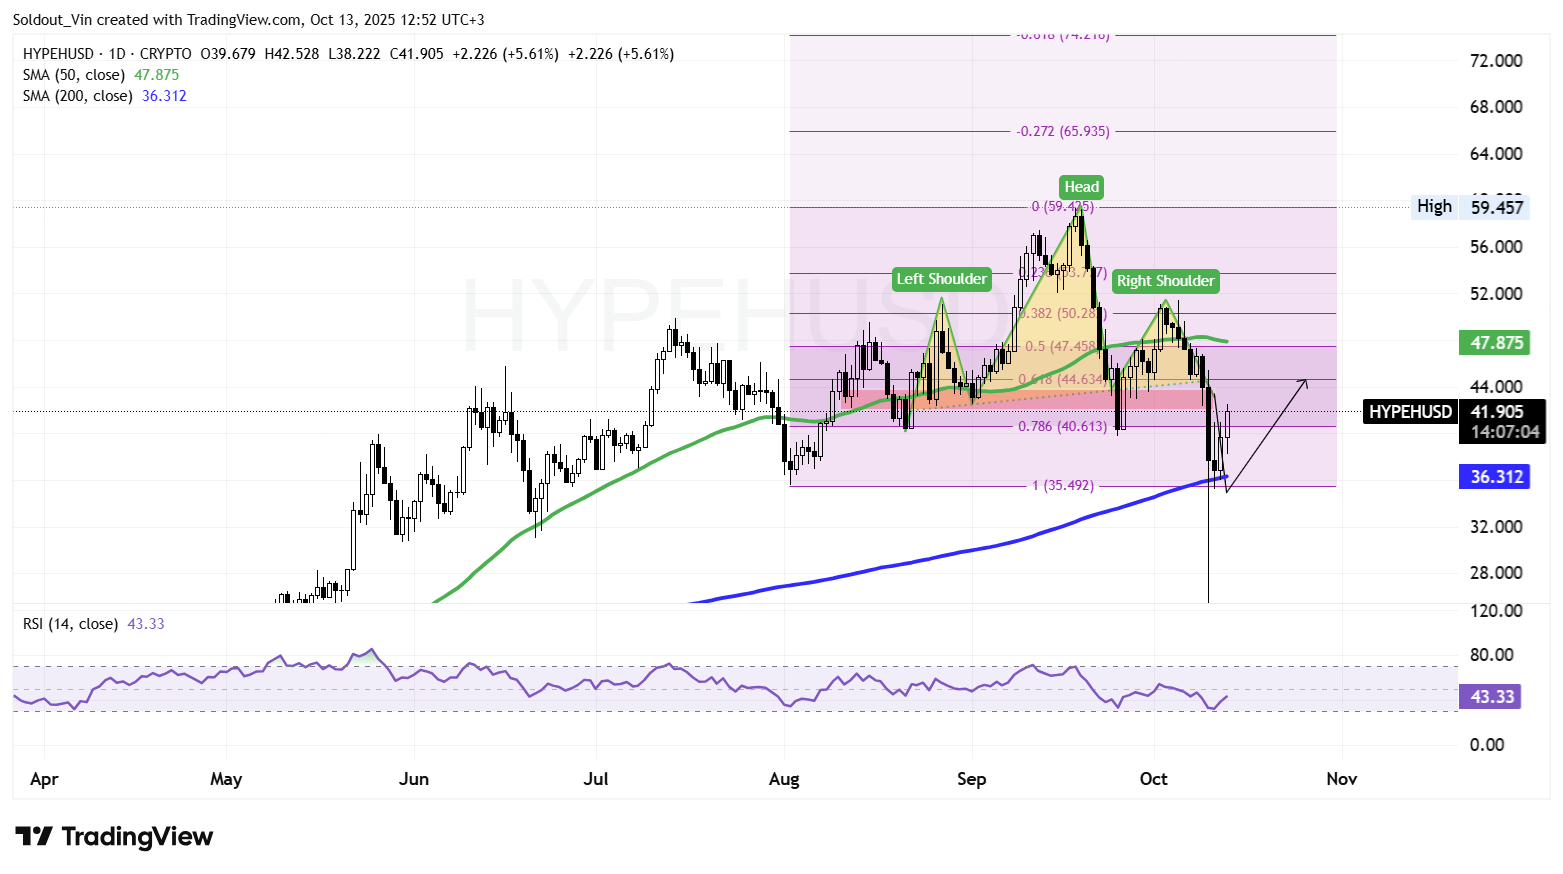
HYPE/USD daily chart (Source: TradingView)
HYPE Price Indicates A Tentative Rebound Before A Major Decision Point
Given the confluence of support at the 200-day SMA and the 0.786 Fibonacci level, the HYPE price may continue to rebound toward the $44–$47 resistance range in the short term. This region also aligns with the neckline area of the broken head-and-shoulders pattern, which could now act as a strong resistance zone.
Conversely, if bulls manage to push and close above the $47.88 (50-day SMA), it could invalidate the bearish bias and open the door for a more sustained move toward the $50–$52 retracement zone.
About Author

About Author




