Official Trump Price Jumps 11% As Trump Pledges $2,000 Checks In Massive Stimulus

The Official Trump price jumped 11% in the past 24 hours to trade at $8.24 as of 5:05 a.m. EST on trading volume that soared 118% to $791 million.
This comes as US President Donald Trump pledged to give every American without a high income $2,000, to be funded by revenues earned by trade tariffs.
“A dividend of at least $2000 a person (not including high income people!) will be paid to everyone,” Trump wrote on his Truth Social platform on Sunday.
Investors and market analysts celebrated the announcement as an effective economic stimulus that may boost cryptocurrency and other asset prices as more funds flow into markets.
The cypto market’s market cap surged 5% to reach $3.68 trillion after the news broke.
Positive market sentiment led to a rise in most major tokens, with Trump’s own meme coin among the top trending cryptos, according to CoinMarketCap.
Official Trump Price Breaks Out Of Downtrend
After being in a steady decline in the past months, the Official Trump price has recently broken above its falling channel pattern, which signals a potential shift in market sentiment.
The breakout, supported by a strong daily candle, has pushed the Official Trump price toward the $8.24 mark, a key level that traders are now watching closely for confirmation of further upside momentum.
The breakout above the upper boundary of the falling channel marks the first significant bullish structure since that downturn, which could support the likelihood of an upward rally.
Meanwhile, the price of TRUMP remains above the 50-day Simple Moving Average (SMA), near $7.08, acting as immediate dynamic support.
Meanwhile, the 200-day SMA, around $9.41, serves as the next major resistance zone. The Relative Strength Index (RSI) stands around 60.03, showing mild bullish momentum without entering overbought territory.
This suggests that the market retains room for further upside, though some consolidation around current levels could occur before a stronger continuation move.
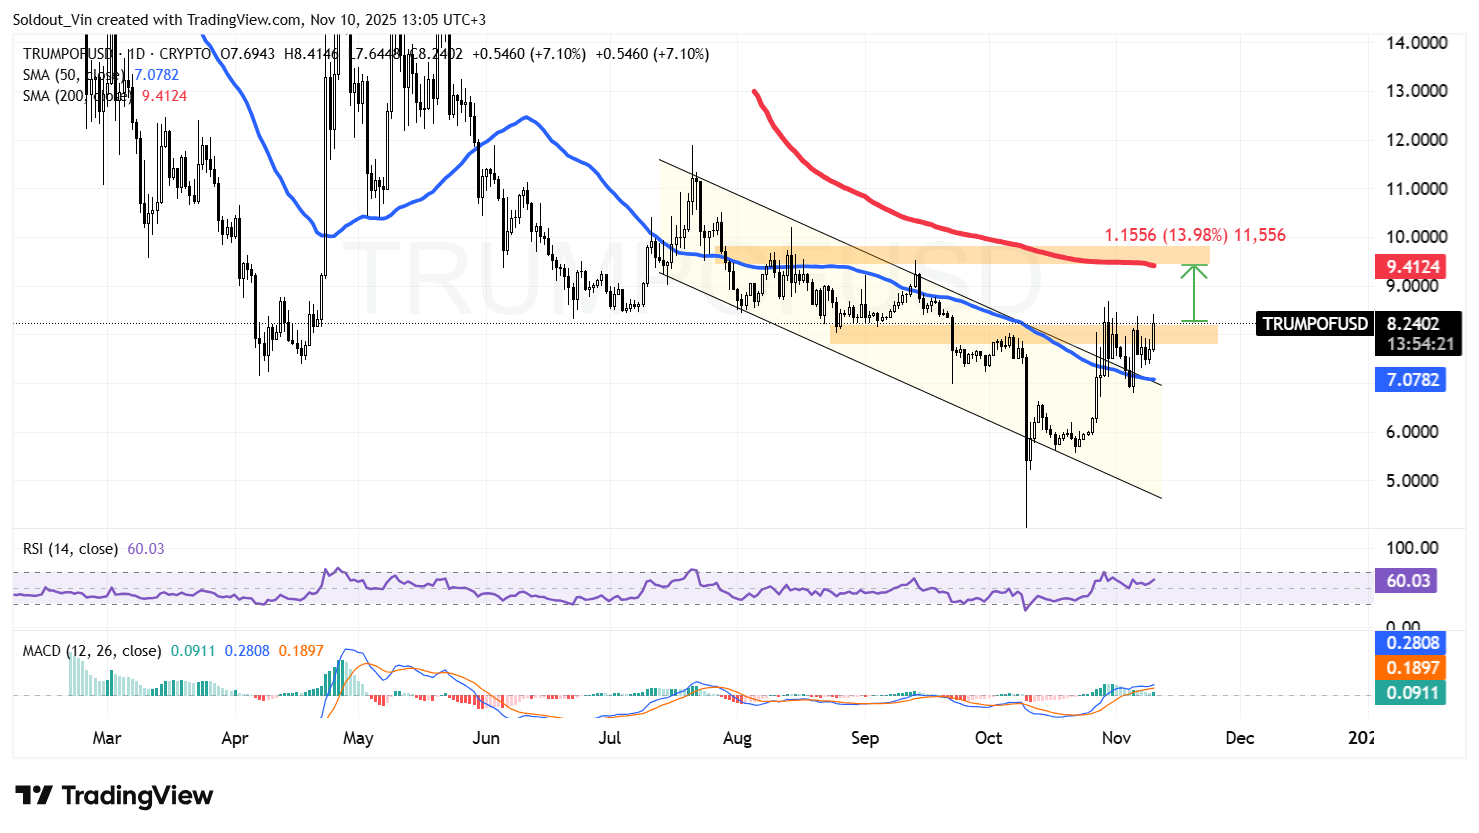
The Moving Average Convergence Divergence (MACD) indicator also reinforces this bullish bias. A recent bullish crossover between the blue MACD and orange signal lines has formed, accompanied by positive histogram bars, which in most cases act as a sign that momentum is building.
TRUMP Eyes Next Resistance At $9.40 And Beyond
From a TRUMP/USD chart analysis structural standpoint, immediate support for the Official Trump price lies at the $7.0–$7.1 zone, aligning with both the 50-day SMA and previous breakout region.
Holding above this zone is crucial for sustaining the bullish breakout narrative for the price of TRUMP. On the upside, the next major resistance comes at $9.4, represented by the 200-day SMA, a 14% potential move from the current level.
However, failure to hold above $7.0 would invalidate this bullish scenario, which could push the price of TRUMP through a retest of prior lows around $6.0.


