Official Trump Price Prediction: TRUMP Soars 14% Ahead Of Fed Rate Decision

The Official Trump price soared 14% in the past 24 hours to trade at $7.76 as of 5:40 a.m. EST on trading volume that jumped 21% to $2 billion.
This comes as the Federal Reserve is expected to cut interest rates by a quarter of a percentage point today.
Economists are expecting the US central bank to reduce its benchmark policy rate to the 3.75%-4% range when the Federal Open Market Committee (FOMC) meeting concludes this afternoon.
A federal government shutdown, now in its 29th day, means the FED did not receive the official employment report covering September.
This is a key input to its policy discussion, as officials focus on the strength of hiring and the evolution of the labor force under President Donald Trump’s tightened immigration policies.
Despite that, the odds of a Fed rate cut continue to soar, and now stand at 99.9%, according to the CME Group’s FedWatch gauge.
A cut is seen as a positive for crypto because lower interest rates reduce borrowing costs and help boost liquidity, often pushing funds into riskier assets like crypto.
Official Trump Price Attempts Bullish Reversal After Prolonged Downtrend
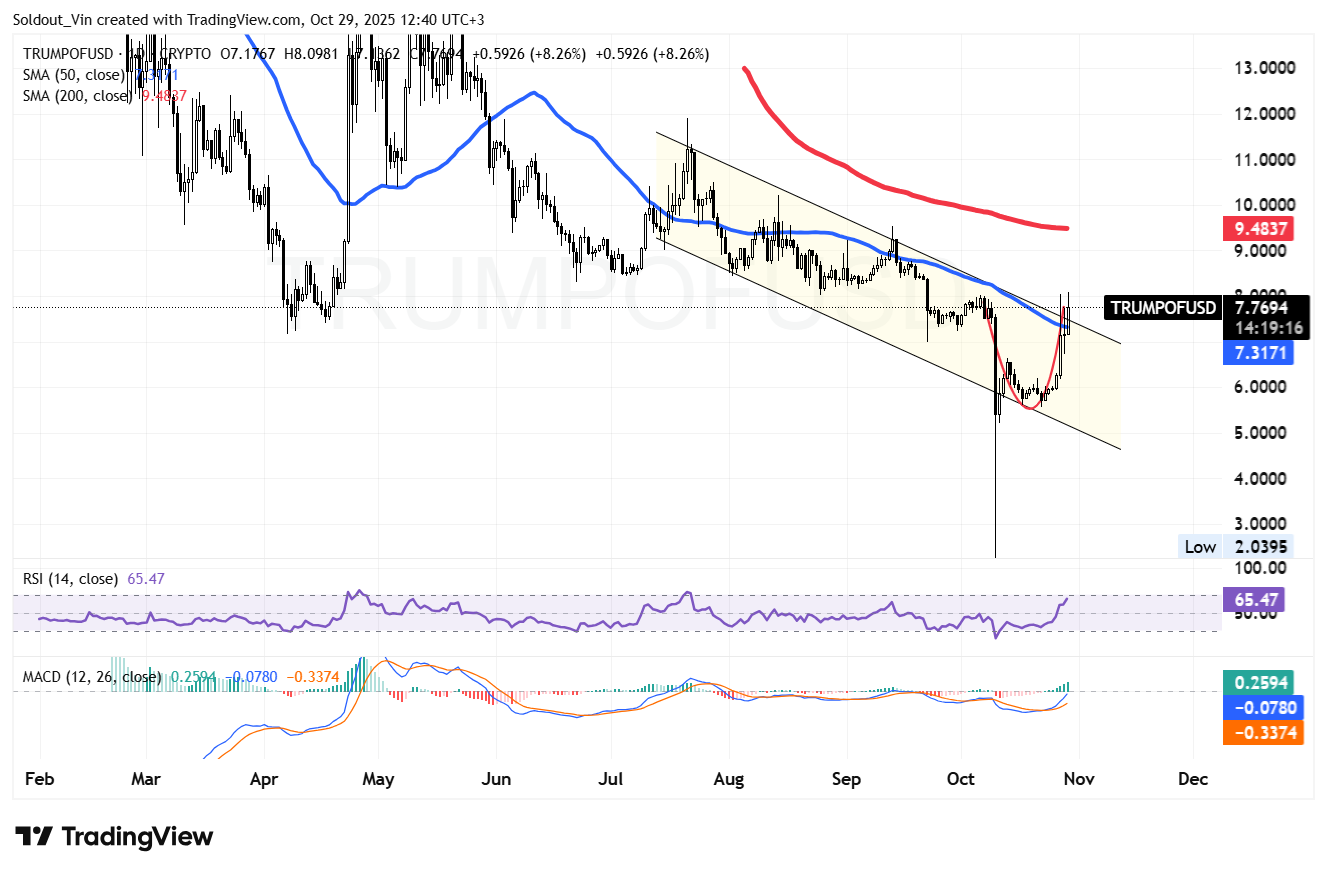
The TRUMP price has been trading within a well-defined falling channel pattern since early May 2025, indicating a sustained bearish trend that has dominated the market for several months.
However, recent Official Trump price action suggests a potential bullish reversal, with buyers aiming to push the token above key resistance levels.
Currently, the price of TRUMP is trading near $7.77, slightly above the 50-day Simple Moving Average (SMA) at $7.31, marking the first sustained move above this level in several weeks.
The 50-day SMA had acted as dynamic resistance throughout the downtrend, and this breakout attempt may signal a shift in market sentiment.
However, the trend remains cautious, though, as the 200-day SMA, positioned around $9.48, still caps the long-term resistance area.
Momentum indicators also support a short-term bullish bias. The Relative Strength Index (RSI) currently stands at 65.47, indicating strong upward momentum but approaching the overbought threshold of 70.
This suggests that while the bullish impulse remains intact, traders should be cautious of possible short-term consolidation before further gains.
Moreover, the MACD (Moving Average Convergence Divergence) has formed a bullish crossover, with the blue MACD line moving above the orange signal line and into positive territory.
TRUMP Price Prediction
According to the TRUMP/USD chart analysis, immediate support for the Official Trump price is seen near $7.30, coinciding with the 50-day SMA, followed by stronger demand near $6.00, the mid-channel zone.
If sellers manage to push the price below $7.00, the breakout could fail, leading to a retest of the lower boundary around $5.00.
In contrast, a decisive close above $8.50 would signal bullish continuation, with the next resistance around $9.50, the area aligned with the 200-day SMA. Breaking this level could open the path toward $10.00–$11.00 over the medium term.