Pi Network Price Prediction: PI Coin Soars 21% As It Joins Ripple And Cardano In ISO 20022

The Pi Network price soared 21% over the last 24 hours to trade at $0.2756 as of 7:21 a.m. EST on trading volume that surged 131% to $130 million.
This comes as Pi Network reportedly joined the ISO 20022 standard group, standing alongside leading crypto companies including Ripple and Cardano.
The move connects Pi to the global financial messaging system used by banks to exchange transaction data.
Joining ISO 20022 brings Pi Network closer to the traditional banking system, improving accuracy, speeding up transaction reconciliation, and strengthening regulatory compliance.
The ISO 20022 link could also help improve the project’s image and build more trust, especially after some critics dismissed it early on.
Pi Network Price Attempts Bullish Reversal After Prolonged Downtrend
The PI Coin price has been trading within a clearly falling channel pattern since mid-May 2025, reflecting a sustained bearish phase that has dominated market sentiment for several months.
However, recent Pi Network price action indicates that buyers may be regaining control, as PI has broken out of its falling channel and is attempting to establish a bullish reversal.
Currently, PI is trading near $0.2756, slightly above the 50-day Simple Moving Average (SMA) at $0.2664, marking the first successful close above this level in an extended period.
Nevertheless, the broader trend remains cautious, as the 200-day SMA, around $0.4743, continues to serve as the long-term resistance zone. This level will be a critical test for confirming any sustained bullish reversal in the weeks ahead.
The Relative Strength Index (RSI) currently stands at 67.88, signaling intense buying pressure but nearing the overbought zone above 70. This suggests that while bullish momentum remains strong, short-term consolidation or a minor pullback could occur before the continuation of further upside.
Moreover, the Moving Average Convergence Divergence (MACD) has confirmed a bullish crossover, with the blue MACD line moving above the orange signal line.
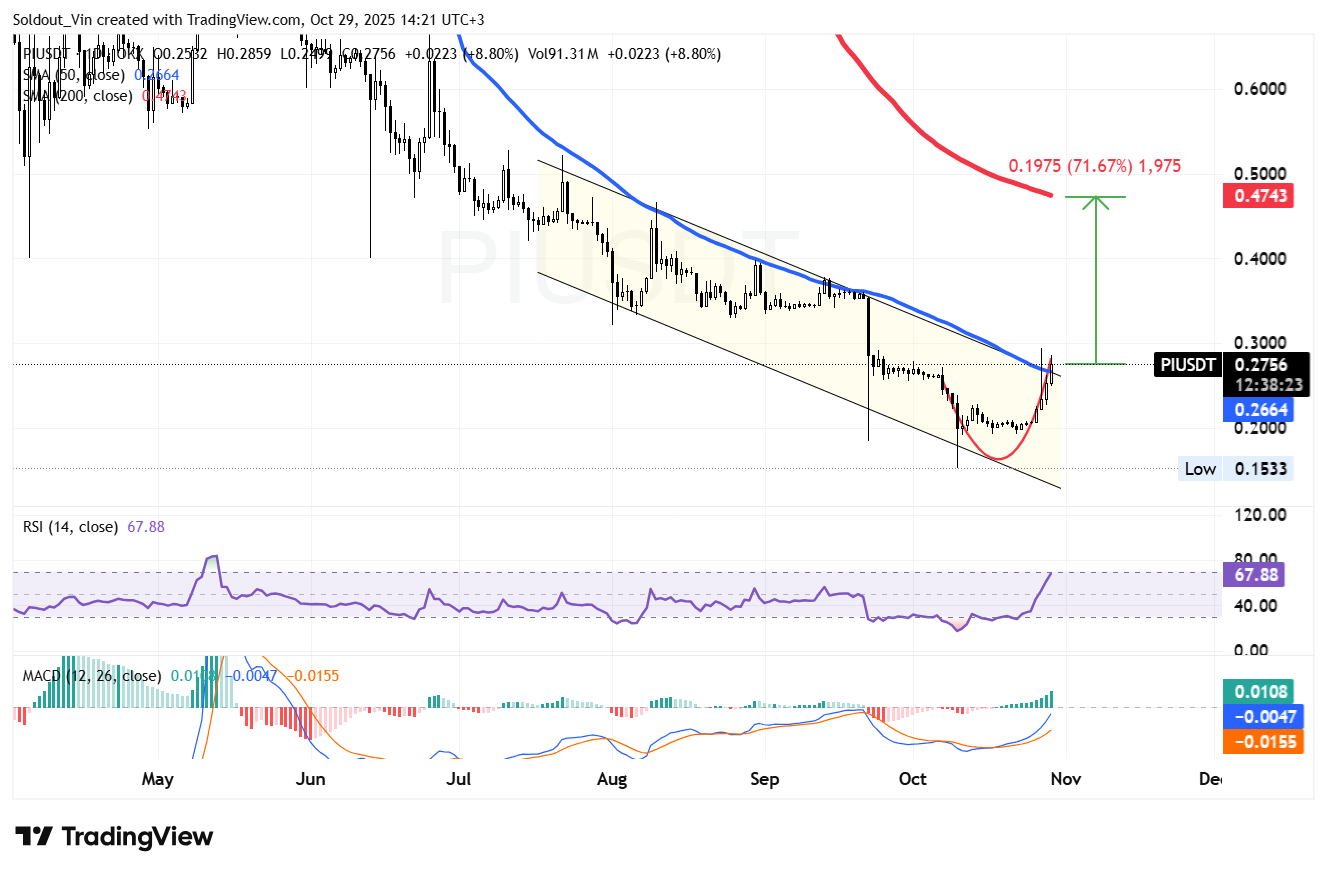
Based on the PIUSDT chart analysis, immediate support for PI lies near $0.266, aligned with the 50-day SMA and the breakout zone. A deeper support level can be found around $0.200, which is in line with the mid-point of the previous falling channel.
If sellers push the Pi Network price back below $0.266, the breakout could lose momentum, leading to a potential retest of the $0.153 low.
Conversely, a decisive close above $0.30 would reinforce the bullish reversal structure. It could trigger a measured move toward $0.47, the area that aligns with the 200-day SMA and represents a potential 71% upside from current levels.


