Solana Price Dips 9% As Grayscale Launches Options Trading For Its Solana Trust ETF (GSOL)

The Solana price has slipped 9% in the last 24 hours, to trade at $157, on a 13% surge in the daily trading volume, to $5.93 billion.
That price surge comes as Grayscale launches options trading for its Solana Trust ETF (GSOL), giving investors more ways to trade and manage risk in the Solana market. The ETF uses 100% staking with no management fees and offers an average 7% annual reward, allowing investors to earn yield while tracking Solana’s price.
This move comes just two weeks after Grayscale launched its SOL ETF, making it the first to offer options on a Solana fund. Soon after, Bitwise Investments followed with options trading for its own Solana ETF (BSOL), showing growing competition in Solana-based products.
Solana spot ETFs have also seen strong demand, with 10 straight days of inflows totaling $342.48 million since trading began on October 28. On November 10 alone, they added $6.78 million.
Even though Solana’s price has dropped 18% in the past month to about $159, its network remains active with over 3.2 million wallets and 70 million daily transactions. The steady inflows and new option products show rising institutional interest and confidence in Solana as a long-term blockchain investment.
Solana Price Indicates Bullish Reversal After Hitting Key Support
Solana (SOL) has been under pressure recently, slipping to $154.71. Despite the recent decline, technical indicators suggest the cryptocurrency may be forming a bullish reversal at an important support level. On the daily chart, SOL has reached a double bottom around $150, a pattern that often signals a potential trend reversal. This indicates that buyers are stepping in to defend this key level.
The formation of a double bottom is usually a reliable sign that the selling pressure may be easing. SOL’s price action suggests it could bounce upward from this support, potentially retesting previous resistance levels if buying momentum continues.
Current resistance is observed near $260, which was the prior monthly high. A clear break above this level could confirm a stronger bullish trend, opening the way for SOL to reach highs seen in late September and early October. On the other hand, a decisive break below $150 could invalidate the reversal setup and lead to further declines.
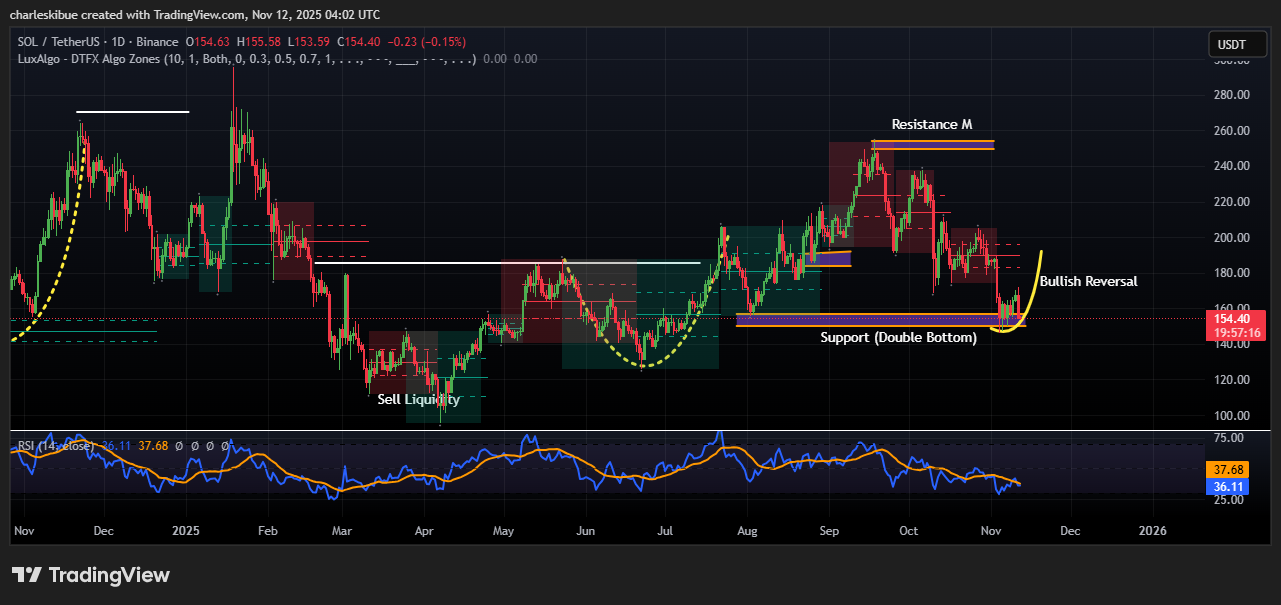
SOLUSDT Analysis Source: Tradingview
The Relative Strength Index (RSI) supports the bullish outlook, currently at 36.26, showing that SOL is in oversold territory. Historically, RSI readings below 40 have coincided with short-term bounces, providing traders with potential entry points. Additionally, the daily trading volume has surged, indicating increased market activity and interest at this support level.
Historical behavior also strengthens the case for a rebound. During previous sell-offs in March and June 2025, SOL consistently found buying interest near key support zones, suggesting that buyers are likely to step in again.
If the bullish reversal plays out, short-term traders could target prices between $180 and $200, while longer-term investors may watch $260 as a confirmation of trend continuation. However, caution is still needed, as SOL remains volatile. Any unexpected drop below the $150 support could trigger more selling.


