Solana Price Prediction: Amid “Extreme Fear,” Santiment Says Crypto Could See “Unexpected” Rally
The Solana price dropped over 1% in the past 24 hours to $155.31 as of 4:46 a.m. EST, while trading volume surged 6% to $6.1 billion.
This decrease in the SOL price comes as the Crypto Fear and Greed Index plummeted to “extreme fear” territory. The index dropped 9 points from yesterday’s 24, as social media comments for Bitcoin were split between bullish and bearish.
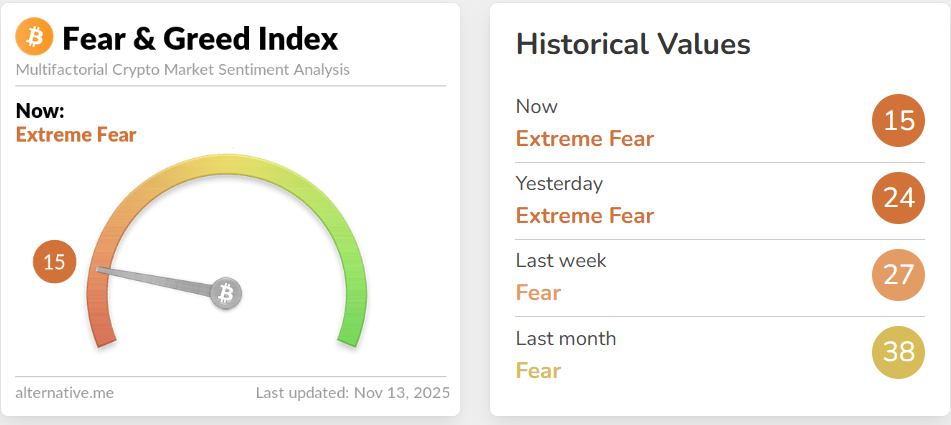
Crypto Fear and Greed Index (Source: Alternative.me)
Meanwhile, Ethereum (ETH) has just over 50% more bullish vs bearish comments.
Amid the fear in the market, on-chain intelligence firm Santiment said on X that the increasingly hostile sentiment among traders and investors could ignite an “unexpected November rally.”
Can the potential surge trickle down to Solana’s price?
Solana Price Holds Key Support As Bulls Eye Recovery
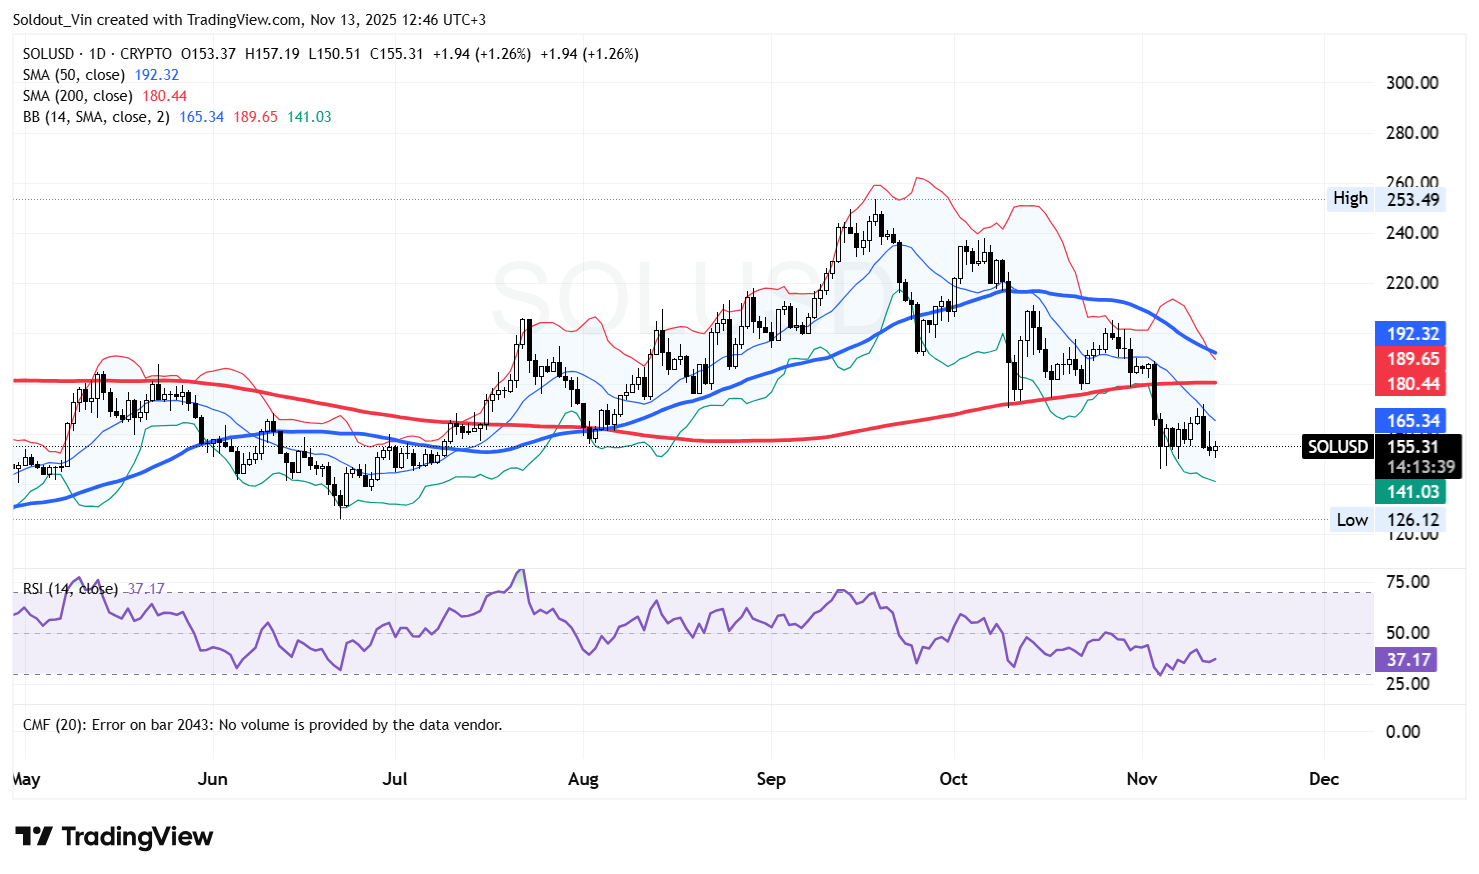
The SOL price has been consolidating after a sustained drop from its previous swing high near $253, which marked the upper boundary of its recent trading range.
That rejection triggered a retracement, pushing the Solana price back toward the $141–$165 support region, an area reinforced by the lower Bollinger Band. This zone has acted as a demand region multiple times in the past, making it an important level for bulls to defend.
SOL is trading around $155.3, signaling major stabilization after a sustained drop below both the 50-day Simple Moving Average (SMA) ($192.3) and the 200-day SMA ($180.4).
The price action of SOL could be forming a potential short-term base, similar to prior accumulation phases that preceded recovery rallies earlier in the year.
While the short-term outlook has turned cautious, Solana’s broader structure could still hold recovery potential if the current support remains intact. The ongoing correction appears to be part of a larger market reset, allowing indicators to cool off before any new rally.
Moreover, the Relative Strength Index (RSI) on the daily timeframe is just above oversold territory at 37, suggesting that bearish momentum is weakening.
SOL Bulls Set To Push Through Key Resistances
According to the current SOL/USD technical structure, the SOL price is attempting to stabilize above the $141–$155 support range.
If bullish momentum builds, the first major resistance for Solana’s price lies near $165, which aligns with the Bollinger mid-band, followed by the $180–$192 zone, where both the 200-day and 50-day SMAs converge.
A decisive breakout above $192 could open the door to a recovery toward $210–$225, which marks the next Fibonacci resistance zone.
Conversely, if bears push the price of Solana below $141, it could expose it to a deeper correction toward $126, the next major horizontal support and previous swing low.


