Solana Price Prediction As Fidelity Adds Solana Trading For Institutional And Retail Clients

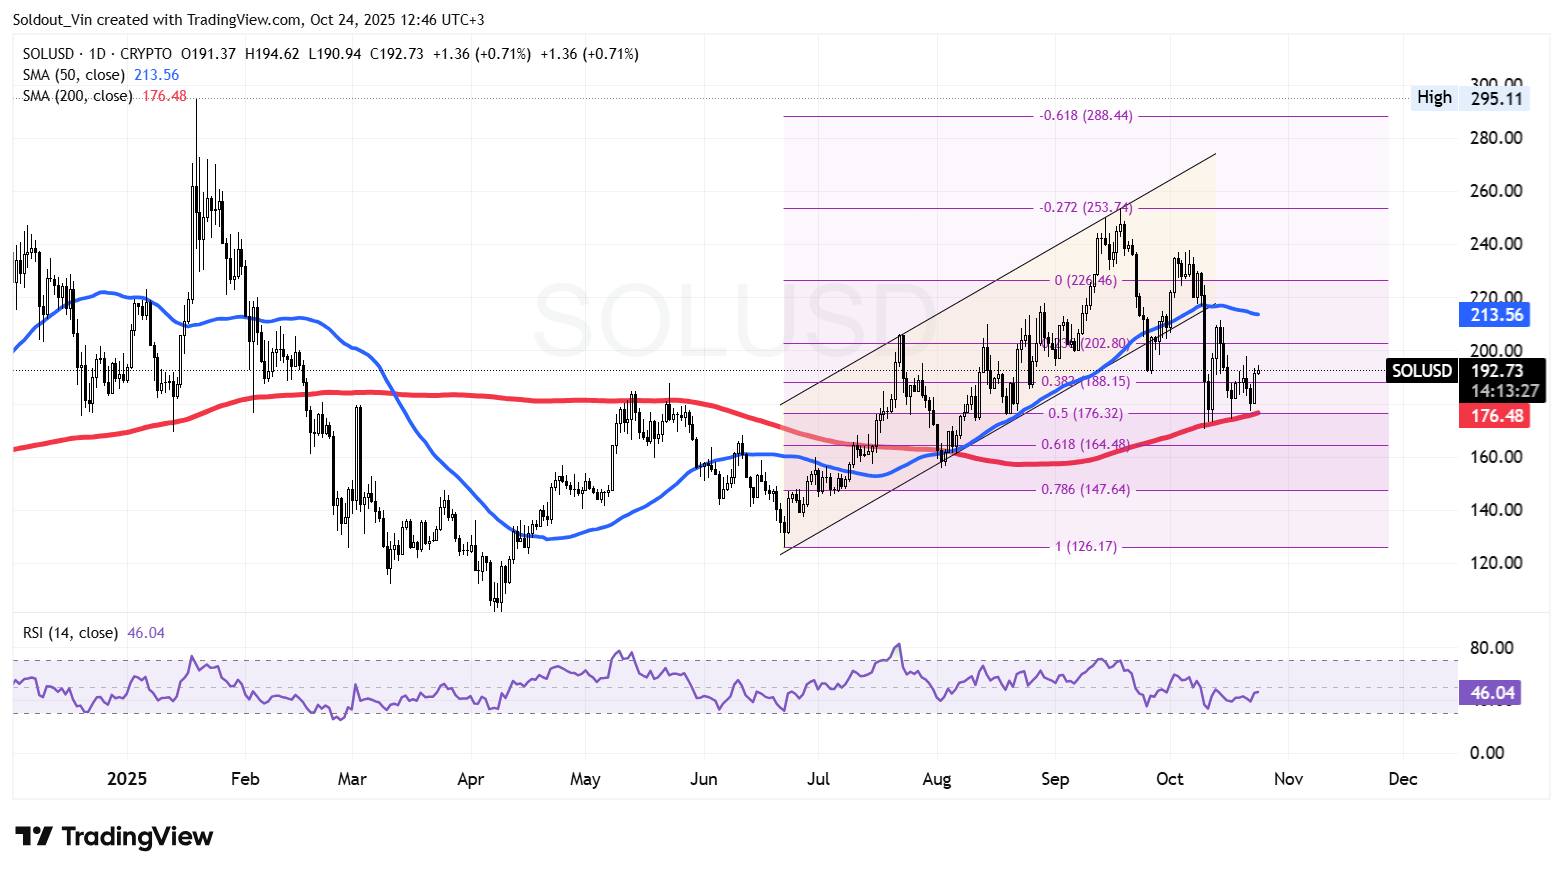
The Solana price climbed over 2% in the past 24 hours to $192.73 as of 5:46 a.m. EST, while trading volume plunged 14% to $6.2 billion.
That comes as Fidelity added Solana (SOL) to its Fidelity Crypto, Fidelity Crypto IRAs, Fidelity Crypto for Wealth Managers, and Fidelity Digital Asset’s platforms.
Nick Ducoff, head of institutional growth at the Solana Foundation, confirmed the rollout by sharing screenshots that showed Solana listed as a tradable asset on Fidelity’s platform.
Solana was chosen because its blockchain can process around 60,000 transactions per minute on average, compared to roughly 250 for Bitcoin and 800 for Ethereum.
Solana Price Holds Key Support As Bulls Eye Recovery
The SOL price has been consolidating after a sharp correction from its recent swing high near $295, which marked the upper boundary of its rising channel.
That rejection triggered a retracement, pushing the Solana price back toward the $176–$188 support region, an area reinforced by the 0.382 and 0.5 Fibonacci levels and the 200-day simple moving average (SMA).
Currently, SOL is trading around $192.7, showing early signs of stabilization after testing the 200-day SMA. SOL price action suggests it may be forming a potential recovery base, similar to previous accumulation patterns that preceded bullish impulses earlier in 2025.
Solana remains within a medium-term bullish structure despite recent weakness. The long-term uptrend, established since mid-2025, is still intact as long as the price holds above the 200-day SMA.
The correction from the $295 high appears to be a healthy pullback, allowing momentum indicators to cool off before potentially resuming the upward trajectory.
Meanwhile, the 50-day SMA ($213.5) is currently sloping slightly downward, signaling that short-term momentum has eased. However, the 200-day SMA ($176.5) remains upward, reflecting sustained long-term strength. The confluence of this level with the 0.5 Fibonacci retracement at $176.3 creates a crucial demand zone where bulls are likely to defend aggressively.
Moreover, the Relative Strength Index (RSI) on the SOL daily chart stands at 46.0, indicating neutral-to-bearish momentum. The RSI hovering near midline territory suggests a potential consolidation or early recovery phase, especially if it manages to reclaim the 50 mark in the coming days.
SOL Bulls Set To Push Through Key Resistances
According to the current SOL/USD technical setup, the Solana token price is attempting to rebound from the $188–$176 support range.
If bullish momentum builds, the next major resistance lies near $202–$213, corresponding with the 50-day SMA. A breakout above this zone could open the door for a move toward $225–$253, aligning with the 0.272 Fibonacci extension.
Conversely, if bears push the price of Solana below $176, it could expose the token to a deeper correction toward the $164 or $148 support levels, representing the 0.618 and 0.786 Fibonacci zones, respectively.