Solana Price Prediction: SOL Plunges 4% As Bitwise Staking ETF BSOL Records First Outflow

The Solana price plunged 4% in the past 24 hours to trade at $126.40 as of 4:47 a.m. EST on trading volume that soared 66% to $5.6 billion.
The drop comes as the Bitwise Solana Staking exchange-traded fund (ETF) (BSOL) recorded its first outflow since its launch amid extreme fear in the crypto market.
The Solana staking ETF offered by Bitwise recorded $4.6 million in net outflows in the latest trading session, according to Coinglass data.
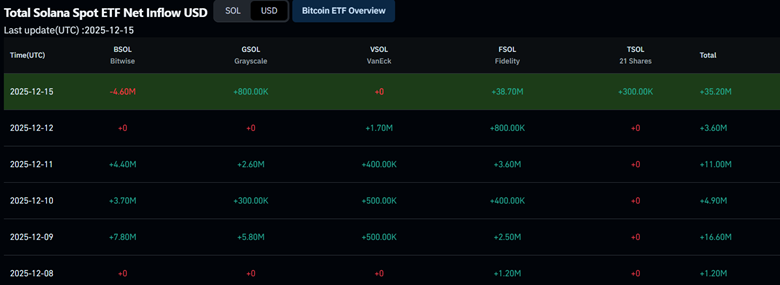
US spot SOL ETF flows (Source: CoinGlass)
With almost 36.86K SOL sold, BSOL recorded its lowest daily trading volume, indicating negative sentiment among investors, which is further fueled by the potential rate hike by the Bank of Japan (BOJ) later this week.
However, spot Solana ETFs recorded net inflows of $35.20 million despite the BSOL outflows.
SOL has now seen a 5% drop in the last week. Will the price continue falling, or are the bulls up for a reversal?
Solana Price Faces Downside Pressure Following Major Trend Reversal
According to the SOL/USD chart analysis on the 3-day timeframe, the SOL price, after reaching a cycle high near $254, has entered a sustained downtrend following the formation of a Head and Shoulders reversal pattern.
The bearish momentum was triggered when the Solana price failed to hold above key supply zones between $210 and $250, and sellers gained control after breaking below the neckline in the $175–$180 region.
That move was further confirmed when the price of SOL fell below both the 50 Simple Moving Average (SMA) at $182.61 and the 200 SMA at $169.58, signaling a shift in the medium- to long-term trend.
SOL is currently hovering around the 0.786 Fibonacci retracement level near $129, a critical demand zone that bulls are attempting to defend.
However, downside pressure remains dominant, and the inability to reclaim the 200-day SMA suggests the broader bearish structure remains intact.
Meanwhile, the RSI remains weak around 33, below the neutral 50 level, indicating that sellers still control the Solana price despite it nearing oversold territory.
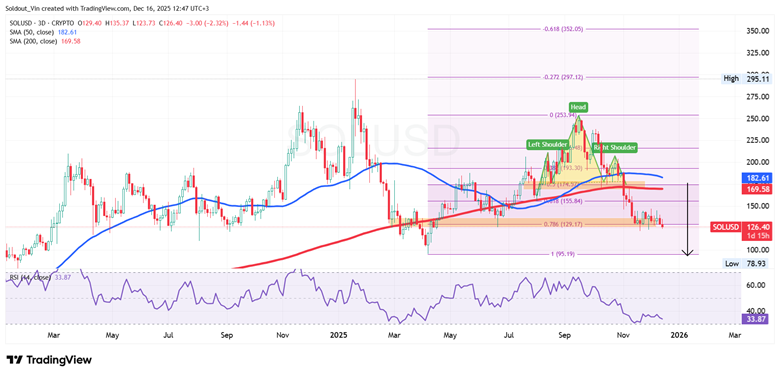
SOL/USD Chart Analysis (Source: TradingView)
SOL Price Outlook
Based on the current SOL/USD technical outlook, the SOL price risks further downside if the $129 support fails.
A confirmed breakdown could open the door to the $95–$100 region, aligning with the measured move target of the Head and Shoulders pattern and the 1.0 Fibonacci extension. Additional downside may expose the $78 support, a key historical low.
Crypto analyst Ali Martinez pointed out that Solana is stuck between $145 and $124. A further pullback could trigger massive liquidations.
Conversely, a sustained defense of the current demand zone, followed by a retest of the $170–$182 resistance zone, could trigger a short-term recovery towards the $200 level.


